29
/pt/
pt
AIzaSyAYiBZKx7MnpbEhh9jyipgxe19OcubqV5w
April 1, 2024
104665
Chile
CHL
true
2
1
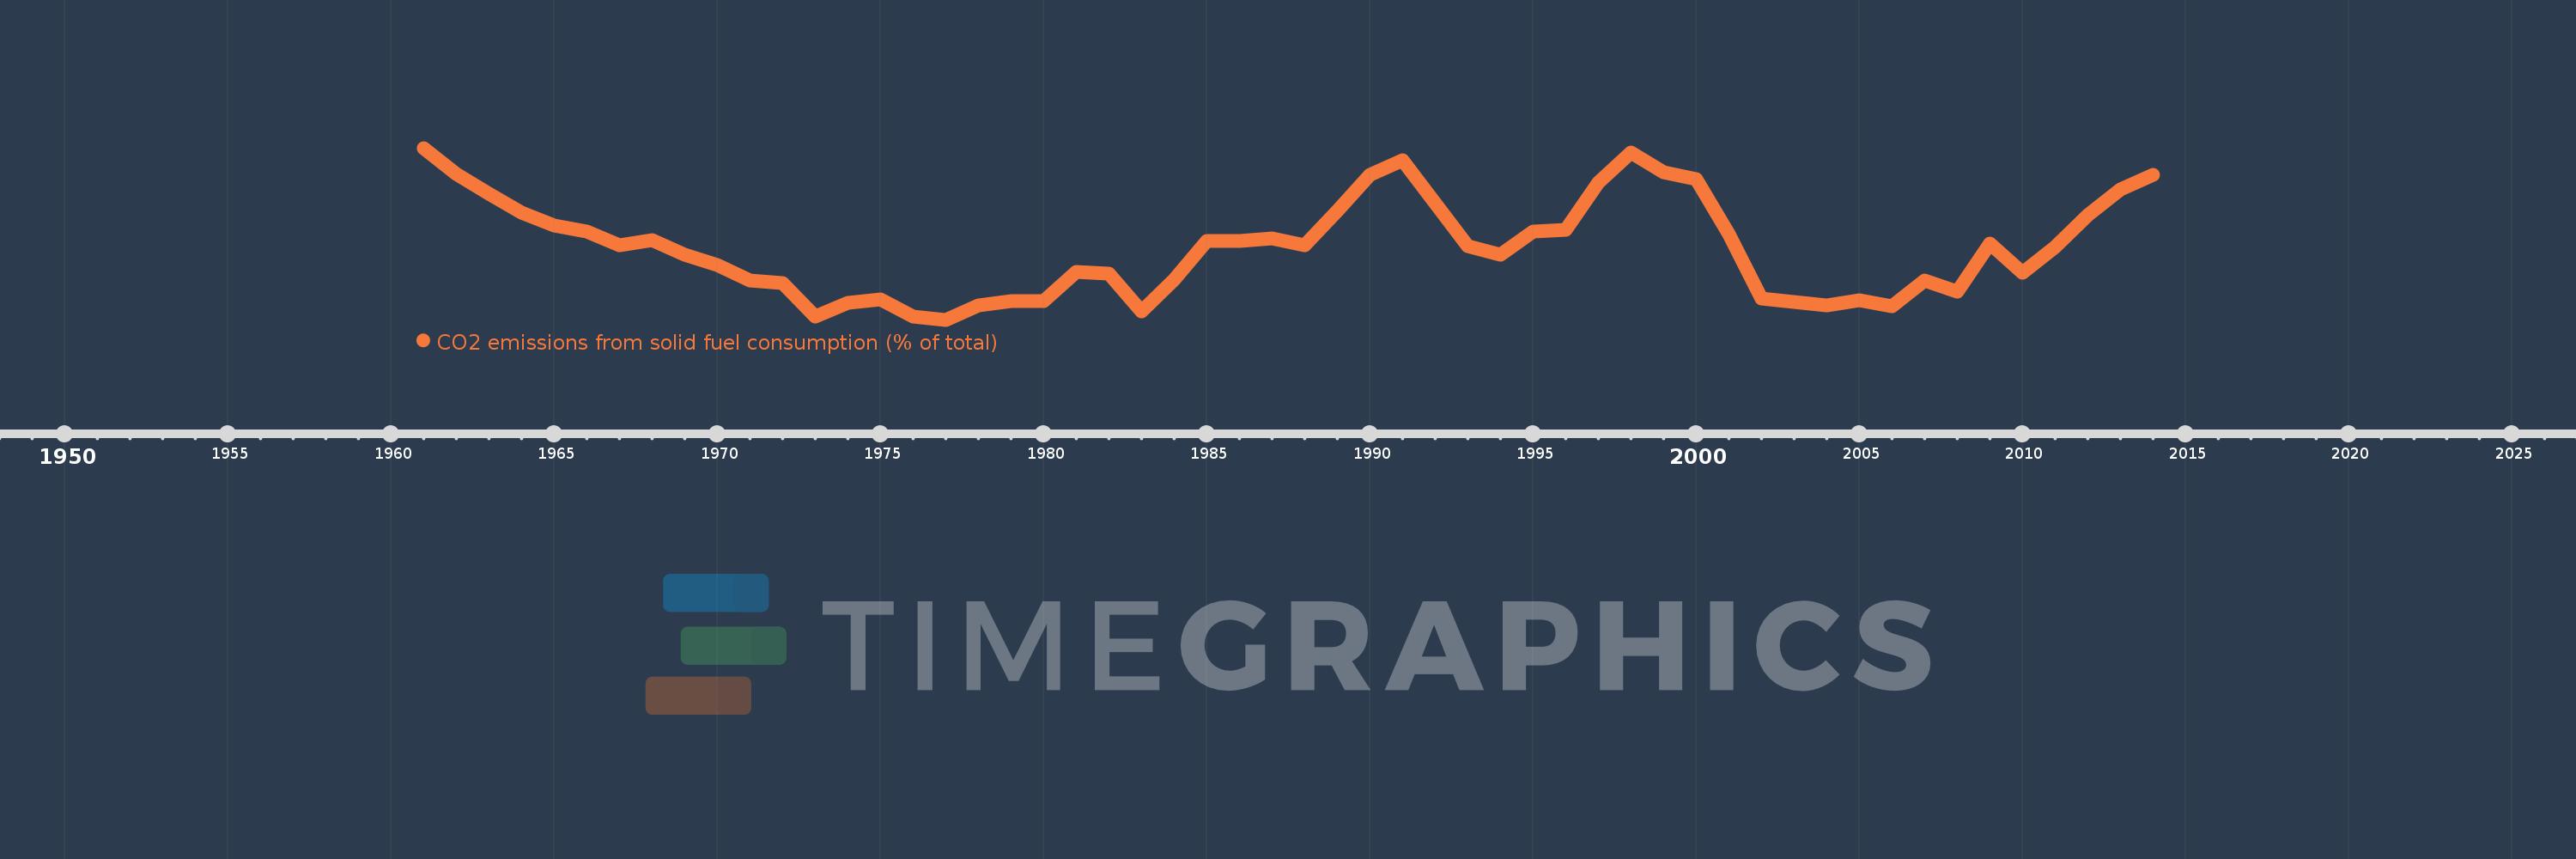
CO2 emissions from solid fuel consumption (% of total)
2014,2013,2012,2011,2010,2009,2008,2007,2006,2005,2004,2003,2002,2001,2000,1999,1998,1997,1996,1995,1994,1993,1992,1991,1990,1989,1988,1987,1986,1985,1984,1983,1982,1981,1980,1979,1978,1977,1976,1975,1974,1973,1972,1971,1970,1969,1968,1967,1966,1965,1964,1963,1962,1961
Estas estatísticas em outros países:
AfghanistanAlbaniaAlgeriaAndorraAngolaAntigua and BarbudaArab WorldArgentinaArmeniaArubaAustraliaAustriaAzerbaijanBahamas, TheBahrainBangladeshBarbadosBelarusBelgiumBelizeBeninBermudaBhutanBoliviaBosnia and HerzegovinaBotswanaBrazilBritish Virgin IslandsBrunei DarussalamBulgariaBurkina FasoBurundiCabo VerdeCambodiaCameroonCanadaCaribbean small statesCayman IslandsCentral African RepublicCentral Europe and the BalticsChadChileChinaColombiaComorosCongo, Dem. Rep.Congo, Rep.Costa RicaCote d'IvoireCroatiaCubaCuracaoCyprusCzech RepublicDenmarkDjiboutiDominicaDominican RepublicEarly-demographic dividendEast Asia & PacificEast Asia & Pacific (excluding high income)East Asia & Pacific (IDA & IBRD countries)EcuadorEgypt, Arab Rep.El SalvadorEquatorial GuineaEritreaEstoniaEthiopiaEuro areaEurope & Central AsiaEurope & Central Asia (excluding high income)Europe & Central Asia (IDA & IBRD countries)European UnionFaroe IslandsFijiFinlandFragile and conflict affected situationsFranceFrench PolynesiaGabonGambia, TheGeorgiaGermanyGhanaGibraltarGreeceGreenlandGrenadaGuatemalaGuineaGuinea-BissauGuyanaHaitiHeavily indebted poor countries (HIPC)High incomeHondurasHong Kong SAR, ChinaHungaryIBRD onlyIcelandIDA & IBRD totalIDA blendIDA onlyIDA totalIndiaIndonesiaIran, Islamic Rep.IraqIrelandIsraelItalyJamaicaJapanJordanKazakhstanKenyaKiribatiKorea, Dem. People’s Rep.Korea, Rep.KuwaitKyrgyz RepublicLao PDRLate-demographic dividendLatin America & Caribbean Latin America & Caribbean (excluding high income)Latin America & the Caribbean (IDA & IBRD countries)LatviaLeast developed countries: UN classificationLebanonLesothoLiberiaLibyaLiechtensteinLithuaniaLow & middle incomeLow incomeLower middle incomeLuxembourgMacao SAR, ChinaMacedonia, FYRMadagascarMalawiMalaysiaMaldivesMaliMaltaMarshall IslandsMauritaniaMauritiusMexicoMicronesia, Fed. Sts.Middle East & North AfricaMiddle East & North Africa (excluding high income)Middle East & North Africa (IDA & IBRD countries)Middle incomeMoldovaMongoliaMontenegroMoroccoMozambiqueMyanmarNamibiaNauruNepalNetherlandsNew CaledoniaNew ZealandNicaraguaNigerNigeriaNorth AmericaNorwayOECD membersOmanOther small statesPacific island small statesPakistanPalauPanamaPapua New GuineaParaguayPeruPhilippinesPolandPortugalPost-demographic dividendPre-demographic dividendQatarRomaniaRussian FederationRwandaSamoaSao Tome and PrincipeSaudi ArabiaSenegalSerbiaSeychellesSierra LeoneSingaporeSint Maarten (Dutch part)Slovak RepublicSloveniaSmall statesSolomon IslandsSomaliaSouth AfricaSouth AsiaSouth Asia (IDA & IBRD)South SudanSpainSri LankaSt. Kitts and NevisSt. LuciaSt. Vincent and the GrenadinesSub-Saharan Africa Sub-Saharan Africa (excluding high income)Sub-Saharan Africa (IDA & IBRD countries)SudanSurinameSwazilandSwedenSwitzerlandSyrian Arab RepublicTajikistanTanzaniaThailandTimor-LesteTogoTongaTrinidad and TobagoTunisiaTurkeyTurkmenistanTurks and Caicos IslandsUgandaUkraineUnited Arab EmiratesUnited KingdomUnited StatesUpper middle incomeUruguayUzbekistanVanuatuVenezuela, RBVietnamWest Bank and GazaWorldYemen, Rep.ZambiaZimbabwe Linha do tempo:
Nesta escala de tempo está apresentado um gráfico de 1961 ano até 2014 ano Chile. Dados de 1960 ano ausente. O número de observações reais por data: 54.
Fonte (nome):
Indicadores de desenvolvimento mundial
Fonte (organização):
Carbon Dioxide Information Analysis Center, Environmental Sciences Division, Oak Ridge National Laboratory, Tennessee, United States.
Categorias:
Climate Change, Environment
Foi atualizado:
23 abr 2017 ano
Indicadores de alterações dos valores ao longo dos anos
Mínimo:
15.138
1 jan 1977 ano
Máximo:
33.46
1 jan 1961 ano
Na data de observação
Valor
Mudança absoluta
A alteração em relação ao valor anterior
1 jan 1961 ano
33.46
+33.46
0.0%
1 jan 1962 ano
30.707
-2.753
-8.23%
1 jan 1963 ano
28.546
-2.16
-7.04%
1 jan 1964 ano
26.537
-2.009
-7.04%
1 jan 1965 ano
25.152
-1.385
-5.22%
1 jan 1966 ano
24.561
-0.59
-2.35%
1 jan 1967 ano
23.083
-1.478
-6.02%
1 jan 1968 ano
23.667
+0.584
2.53%
1 jan 1969 ano
22.097
-1.57
-6.63%
1 jan 1970 ano
20.988
-1.109
-5.02%
1 jan 1971 ano
19.328
-1.66
-7.91%
1 jan 1972 ano
19.028
-0.3
-1.55%
1 jan 1973 ano
15.466
-3.563
-18.72%
1 jan 1974 ano
16.908
+1.442
9.32%
1 jan 1975 ano
17.307
+0.4
2.36%
1 jan 1976 ano
15.519
-1.788
-10.33%
1 jan 1977 ano
15.138
-0.382
-2.46%
1 jan 1978 ano
16.677
+1.54
10.17%
1 jan 1979 ano
17.082
+0.405
2.43%
1 jan 1980 ano
17.094
+0.012
0.07%
1 jan 1981 ano
20.276
+3.181
18.61%
1 jan 1982 ano
20.102
-0.174
-0.86%
1 jan 1983 ano
15.991
-4.111
-20.45%
1 jan 1984 ano
19.409
+3.418
21.37%
1 jan 1985 ano
23.555
+4.146
21.36%
1 jan 1986 ano
23.533
-0.021
-0.09%
1 jan 1987 ano
23.834
+0.3
1.28%
1 jan 1988 ano
23.096
-0.738
-3.1%
1 jan 1989 ano
26.719
+3.624
15.69%
1 jan 1990 ano
30.548
+3.829
14.33%
1 jan 1991 ano
32.163
+1.615
5.29%
1 jan 1992 ano
27.57
-4.593
-14.28%
1 jan 1993 ano
22.979
-4.591
-16.65%
1 jan 1994 ano
22.048
-0.931
-4.05%
1 jan 1995 ano
24.589
+2.541
11.52%
1 jan 1996 ano
24.719
+0.13
0.53%
1 jan 1997 ano
29.744
+5.026
20.33%
1 jan 1998 ano
33.019
+3.275
11.01%
1 jan 1999 ano
30.854
-2.165
-6.56%
1 jan 2000 ano
30.134
-0.721
-2.34%
1 jan 2001 ano
24.235
-5.899
-19.58%
1 jan 2002 ano
17.379
-6.855
-28.29%
1 jan 2003 ano
17.018
-0.361
-2.08%
1 jan 2004 ano
16.639
-0.379
-2.23%
1 jan 2005 ano
17.214
+0.574
3.45%
1 jan 2006 ano
16.597
-0.616
-3.58%
1 jan 2007 ano
19.361
+2.763
16.65%
1 jan 2008 ano
18.172
-1.189
-6.14%
1 jan 2009 ano
23.308
+5.137
28.27%
1 jan 2010 ano
20.123
-3.185
-13.67%
1 jan 2011 ano
22.89
+2.767
13.75%
1 jan 2012 ano
26.33
+3.44
15.03%
1 jan 2013 ano
29.015
+2.684
10.19%
1 jan 2014 ano
30.559
+1.544
5.32%
Classificação de países por estatísticas atuais por anos


Comentários: