29
/pt/
pt
AIzaSyAYiBZKx7MnpbEhh9jyipgxe19OcubqV5w
April 1, 2024
29122
East Asia & Pacific (IDA & IBRD countries)
TEA
false
2
1
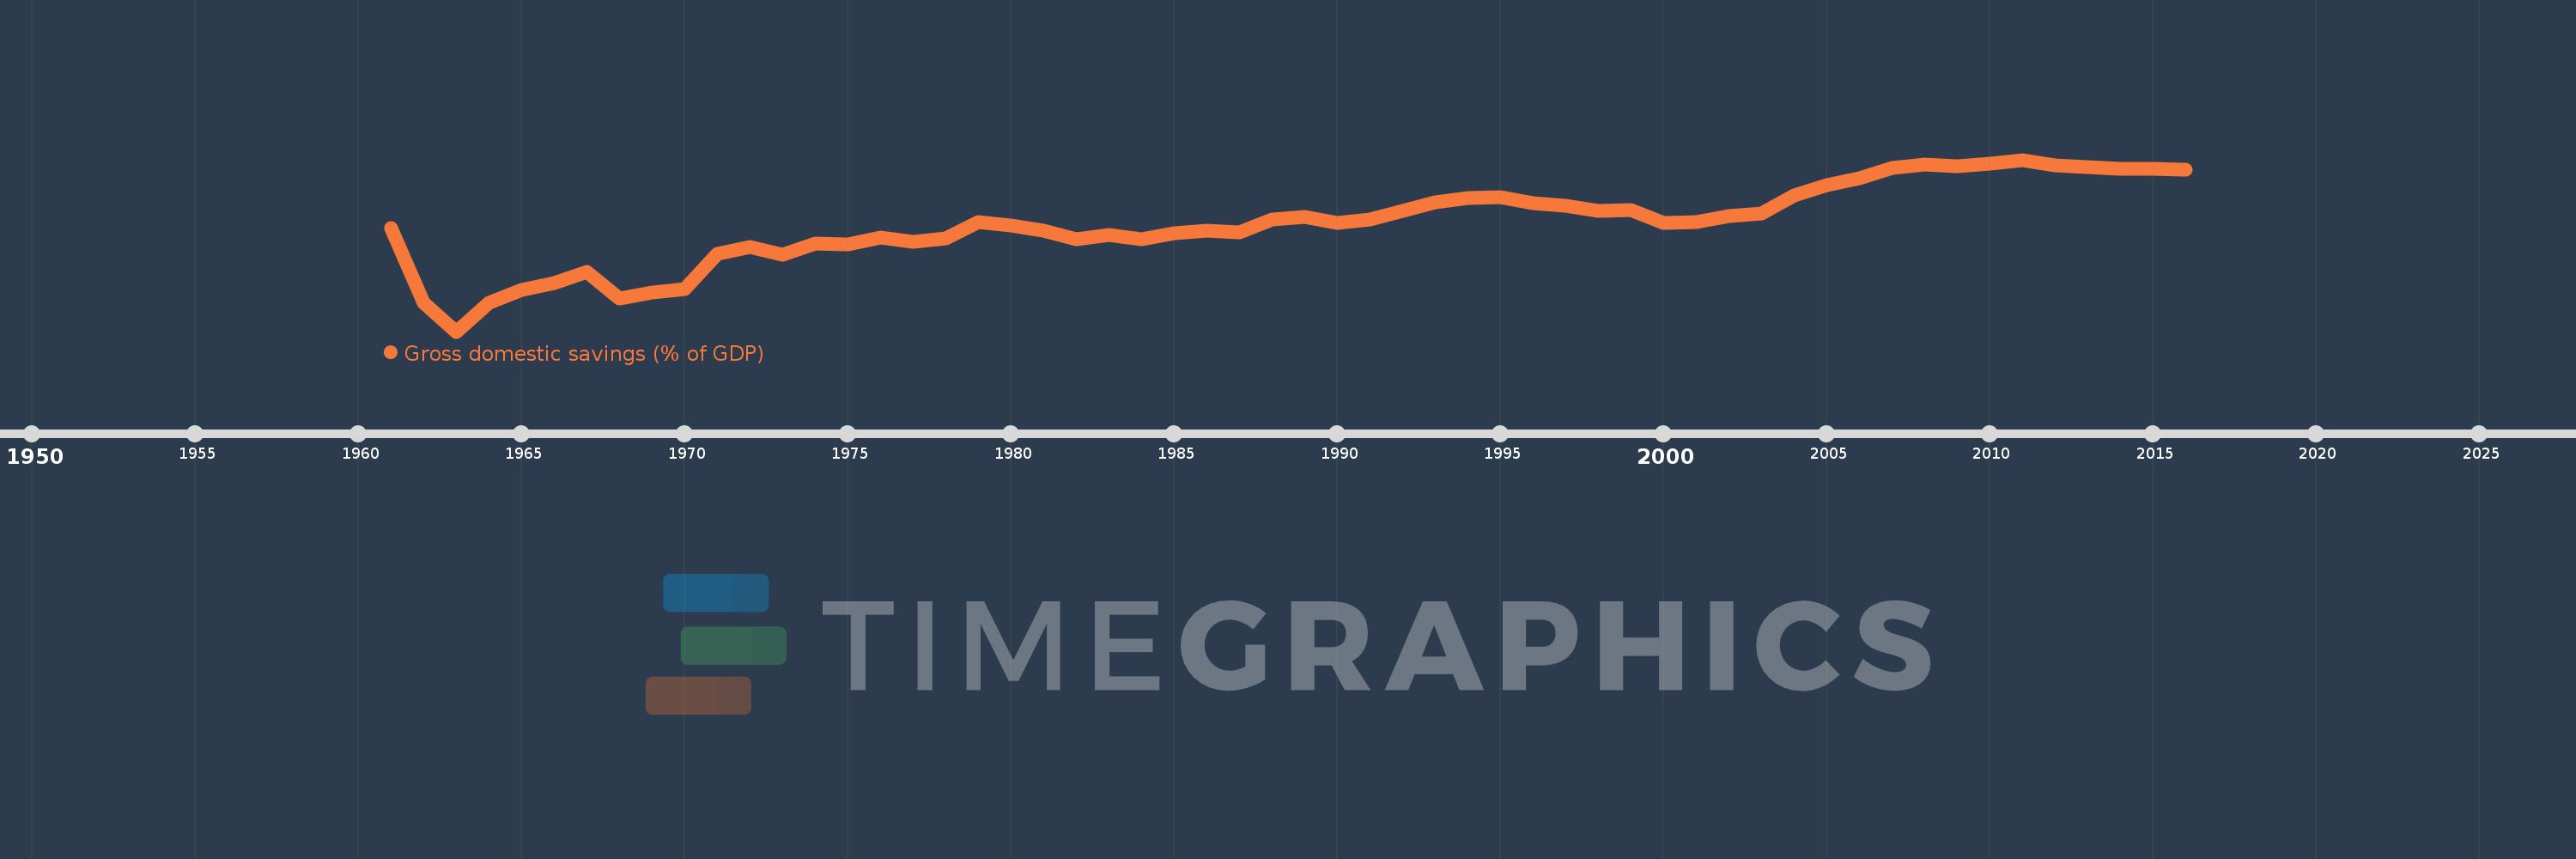
Gross domestic savings (% of GDP)
2016,2015,2014,2013,2012,2011,2010,2009,2008,2007,2006,2005,2004,2003,2002,2001,2000,1999,1998,1997,1996,1995,1994,1993,1992,1991,1990,1989,1988,1987,1986,1985,1984,1983,1982,1981,1980,1979,1978,1977,1976,1975,1974,1973,1972,1971,1970,1969,1968,1967,1966,1965,1964,1963,1962,1961
Estas estatísticas em outros países:
AfghanistanAlbaniaAlgeriaAngolaAntigua and BarbudaArab WorldArgentinaArmeniaArubaAustraliaAustriaAzerbaijanBahamas, TheBahrainBangladeshBarbadosBelarusBelgiumBelizeBeninBermudaBhutanBoliviaBosnia and HerzegovinaBotswanaBrazilBrunei DarussalamBulgariaBurkina FasoBurundiCabo VerdeCambodiaCameroonCanadaCaribbean small statesCentral African RepublicCentral Europe and the BalticsChadChileChinaColombiaComorosCongo, Dem. Rep.Congo, Rep.Costa RicaCote d'IvoireCroatiaCubaCyprusCzech RepublicDenmarkDjiboutiDominicaDominican RepublicEarly-demographic dividendEast Asia & PacificEast Asia & Pacific (excluding high income)East Asia & Pacific (IDA & IBRD countries)EcuadorEgypt, Arab Rep.El SalvadorEquatorial GuineaEritreaEstoniaEthiopiaEuro areaEurope & Central AsiaEurope & Central Asia (excluding high income)Europe & Central Asia (IDA & IBRD countries)European UnionFaroe IslandsFijiFinlandFragile and conflict affected situationsFranceGabonGambia, TheGeorgiaGermanyGhanaGreeceGrenadaGuatemalaGuineaGuinea-BissauGuyanaHaitiHeavily indebted poor countries (HIPC)High incomeHondurasHong Kong SAR, ChinaHungaryIBRD onlyIcelandIDA & IBRD totalIDA blendIDA onlyIDA totalIndiaIndonesiaIran, Islamic Rep.IraqIrelandIsraelItalyJamaicaJapanJordanKazakhstanKenyaKiribatiKorea, Rep.KosovoKuwaitKyrgyz RepublicLao PDRLate-demographic dividendLatin America & Caribbean Latin America & Caribbean (excluding high income)Latin America & the Caribbean (IDA & IBRD countries)LatviaLeast developed countries: UN classificationLebanonLesothoLiberiaLibyaLithuaniaLow & middle incomeLow incomeLower middle incomeLuxembourgMacao SAR, ChinaMacedonia, FYRMadagascarMalawiMalaysiaMaldivesMaliMaltaMauritaniaMauritiusMexicoMicronesia, Fed. Sts.Middle East & North AfricaMiddle East & North Africa (excluding high income)Middle East & North Africa (IDA & IBRD countries)Middle incomeMoldovaMongoliaMontenegroMoroccoMozambiqueNamibiaNepalNetherlandsNew CaledoniaNew ZealandNicaraguaNigerNigeriaNorth AmericaNorwayOECD membersOmanOther small statesPacific island small statesPakistanPanamaPapua New GuineaParaguayPeruPhilippinesPolandPortugalPost-demographic dividendPre-demographic dividendPuerto RicoQatarRomaniaRussian FederationRwandaSaudi ArabiaSenegalSerbiaSeychellesSierra LeoneSingaporeSlovak RepublicSloveniaSmall statesSolomon IslandsSomaliaSouth AfricaSouth AsiaSouth Asia (IDA & IBRD)South SudanSpainSri LankaSt. Kitts and NevisSt. LuciaSt. Vincent and the GrenadinesSub-Saharan Africa Sub-Saharan Africa (excluding high income)Sub-Saharan Africa (IDA & IBRD countries)SudanSurinameSwazilandSwedenSwitzerlandSyrian Arab RepublicTajikistanTanzaniaThailandTimor-LesteTogoTongaTrinidad and TobagoTunisiaTurkeyTurkmenistanUgandaUkraineUnited Arab EmiratesUnited KingdomUnited StatesUpper middle incomeUruguayUzbekistanVanuatuVenezuela, RBVietnamWest Bank and GazaWorldYemen, Rep.ZambiaZimbabwe Linha do tempo:
Nesta escala de tempo está apresentado um gráfico de 1961 ano até 2016 ano East Asia & Pacific (IDA & IBRD countries). Dados de 1960 ano ausente. O número de observações reais por data: 56.
Fonte (nome):
Indicadores de desenvolvimento mundial
Fonte (organização):
World Bank national accounts data, and OECD National Accounts data files.
Categorias:
Economy & Growth
Foi atualizado:
23 abr 2017 ano
Indicadores de alterações dos valores ao longo dos anos
Mínimo:
16.013
1 jan 1963 ano
Máximo:
46.988
1 jan 2011 ano
Na data de observação
Valor
Mudança absoluta
A alteração em relação ao valor anterior
1 jan 1961 ano
34.702
+34.702
0.0%
1 jan 1962 ano
21.208
-13.494
-38.89%
1 jan 1963 ano
16.013
-5.195
-24.49%
1 jan 1964 ano
21.197
+5.183
32.37%
1 jan 1965 ano
23.492
+2.296
10.83%
1 jan 1966 ano
24.802
+1.309
5.57%
1 jan 1967 ano
26.732
+1.931
7.78%
1 jan 1968 ano
21.901
-4.831
-18.07%
1 jan 1969 ano
23.118
+1.217
5.56%
1 jan 1970 ano
23.633
+0.515
2.23%
1 jan 1971 ano
30.07
+6.437
27.24%
1 jan 1972 ano
31.251
+1.181
3.93%
1 jan 1973 ano
29.878
-1.374
-4.4%
1 jan 1974 ano
31.83
+1.953
6.54%
1 jan 1975 ano
31.691
-0.14
-0.44%
1 jan 1976 ano
32.974
+1.283
4.05%
1 jan 1977 ano
32.148
-0.826
-2.5%
1 jan 1978 ano
32.869
+0.721
2.24%
1 jan 1979 ano
35.782
+2.913
8.86%
1 jan 1980 ano
35.104
-0.678
-1.89%
1 jan 1981 ano
34.243
-0.861
-2.45%
1 jan 1982 ano
32.648
-1.595
-4.66%
1 jan 1983 ano
33.47
+0.822
2.52%
1 jan 1984 ano
32.632
-0.838
-2.5%
1 jan 1985 ano
33.713
+1.081
3.31%
1 jan 1986 ano
34.188
+0.475
1.41%
1 jan 1987 ano
33.83
-0.358
-1.05%
1 jan 1988 ano
36.159
+2.329
6.88%
1 jan 1989 ano
36.744
+0.585
1.62%
1 jan 1990 ano
35.654
-1.091
-2.97%
1 jan 1991 ano
36.234
+0.58
1.63%
1 jan 1992 ano
37.787
+1.553
4.29%
1 jan 1993 ano
39.298
+1.511
4.0%
1 jan 1994 ano
40.058
+0.76
1.93%
1 jan 1995 ano
40.287
+0.229
0.57%
1 jan 1996 ano
39.153
-1.135
-2.82%
1 jan 1997 ano
38.679
-0.474
-1.21%
1 jan 1998 ano
37.802
-0.877
-2.27%
1 jan 1999 ano
37.961
+0.159
0.42%
1 jan 2000 ano
35.635
-2.326
-6.13%
1 jan 2001 ano
35.7
+0.065
0.18%
1 jan 2002 ano
36.843
+1.144
3.2%
1 jan 2003 ano
37.243
+0.399
1.08%
1 jan 2004 ano
40.604
+3.361
9.02%
1 jan 2005 ano
42.357
+1.753
4.32%
1 jan 2006 ano
43.604
+1.247
2.94%
1 jan 2007 ano
45.503
+1.899
4.36%
1 jan 2008 ano
46.194
+0.691
1.52%
1 jan 2009 ano
45.759
-0.435
-0.94%
1 jan 2010 ano
46.223
+0.463
1.01%
1 jan 2011 ano
46.988
+0.766
1.66%
1 jan 2012 ano
45.907
-1.081
-2.3%
1 jan 2013 ano
45.687
-0.22
-0.48%
1 jan 2014 ano
45.436
-0.25
-0.55%
1 jan 2015 ano
45.334
-0.103
-0.23%
1 jan 2016 ano
45.21
-0.124
-0.27%
Classificação de países por estatísticas atuais por anos


Comentários: