29
/pt/
pt
AIzaSyAYiBZKx7MnpbEhh9jyipgxe19OcubqV5w
April 1, 2024
209364
New Zealand
NZL
true
2
1
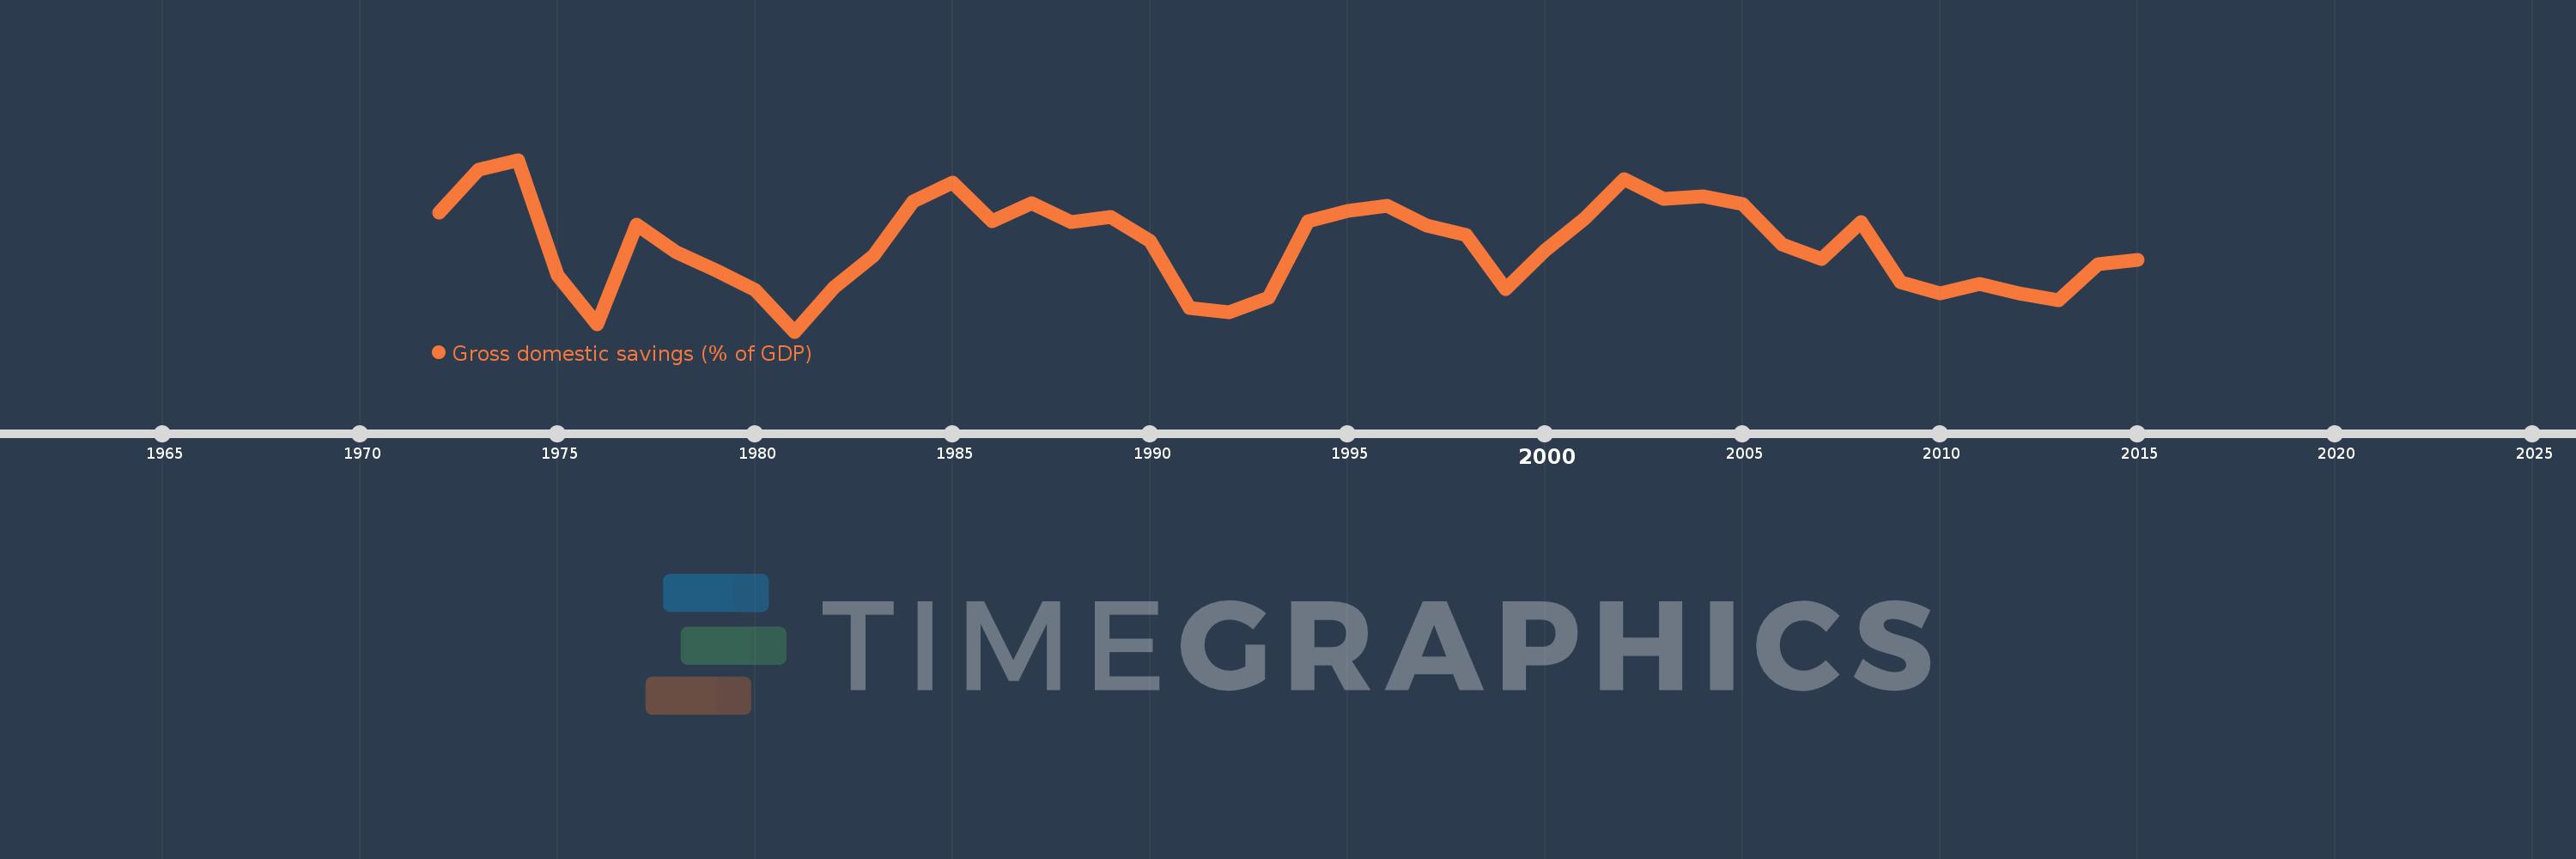
Gross domestic savings (% of GDP)
2015,2014,2013,2012,2011,2010,2009,2008,2007,2006,2005,2004,2003,2002,2001,2000,1999,1998,1997,1996,1995,1994,1993,1992,1991,1990,1989,1988,1987,1986,1985,1984,1983,1982,1981,1980,1979,1978,1977,1976,1975,1974,1973,1972
Estas estatísticas em outros países:
AfghanistanAlbaniaAlgeriaAngolaAntigua and BarbudaArab WorldArgentinaArmeniaArubaAustraliaAustriaAzerbaijanBahamas, TheBahrainBangladeshBarbadosBelarusBelgiumBelizeBeninBermudaBhutanBoliviaBosnia and HerzegovinaBotswanaBrazilBrunei DarussalamBulgariaBurkina FasoBurundiCabo VerdeCambodiaCameroonCanadaCaribbean small statesCentral African RepublicCentral Europe and the BalticsChadChileChinaColombiaComorosCongo, Dem. Rep.Congo, Rep.Costa RicaCote d'IvoireCroatiaCubaCyprusCzech RepublicDenmarkDjiboutiDominicaDominican RepublicEarly-demographic dividendEast Asia & PacificEast Asia & Pacific (excluding high income)East Asia & Pacific (IDA & IBRD countries)EcuadorEgypt, Arab Rep.El SalvadorEquatorial GuineaEritreaEstoniaEthiopiaEuro areaEurope & Central AsiaEurope & Central Asia (excluding high income)Europe & Central Asia (IDA & IBRD countries)European UnionFaroe IslandsFijiFinlandFragile and conflict affected situationsFranceGabonGambia, TheGeorgiaGermanyGhanaGreeceGrenadaGuatemalaGuineaGuinea-BissauGuyanaHaitiHeavily indebted poor countries (HIPC)High incomeHondurasHong Kong SAR, ChinaHungaryIBRD onlyIcelandIDA & IBRD totalIDA blendIDA onlyIDA totalIndiaIndonesiaIran, Islamic Rep.IraqIrelandIsraelItalyJamaicaJapanJordanKazakhstanKenyaKiribatiKorea, Rep.KosovoKuwaitKyrgyz RepublicLao PDRLate-demographic dividendLatin America & Caribbean Latin America & Caribbean (excluding high income)Latin America & the Caribbean (IDA & IBRD countries)LatviaLeast developed countries: UN classificationLebanonLesothoLiberiaLibyaLithuaniaLow & middle incomeLow incomeLower middle incomeLuxembourgMacao SAR, ChinaMacedonia, FYRMadagascarMalawiMalaysiaMaldivesMaliMaltaMauritaniaMauritiusMexicoMicronesia, Fed. Sts.Middle East & North AfricaMiddle East & North Africa (excluding high income)Middle East & North Africa (IDA & IBRD countries)Middle incomeMoldovaMongoliaMontenegroMoroccoMozambiqueNamibiaNepalNetherlandsNew CaledoniaNew ZealandNicaraguaNigerNigeriaNorth AmericaNorwayOECD membersOmanOther small statesPacific island small statesPakistanPanamaPapua New GuineaParaguayPeruPhilippinesPolandPortugalPost-demographic dividendPre-demographic dividendPuerto RicoQatarRomaniaRussian FederationRwandaSaudi ArabiaSenegalSerbiaSeychellesSierra LeoneSingaporeSlovak RepublicSloveniaSmall statesSolomon IslandsSomaliaSouth AfricaSouth AsiaSouth Asia (IDA & IBRD)South SudanSpainSri LankaSt. Kitts and NevisSt. LuciaSt. Vincent and the GrenadinesSub-Saharan Africa Sub-Saharan Africa (excluding high income)Sub-Saharan Africa (IDA & IBRD countries)SudanSurinameSwazilandSwedenSwitzerlandSyrian Arab RepublicTajikistanTanzaniaThailandTimor-LesteTogoTongaTrinidad and TobagoTunisiaTurkeyTurkmenistanUgandaUkraineUnited Arab EmiratesUnited KingdomUnited StatesUpper middle incomeUruguayUzbekistanVanuatuVenezuela, RBVietnamWest Bank and GazaWorldYemen, Rep.ZambiaZimbabwe Linha do tempo:
Nesta escala de tempo está apresentado um gráfico de 1972 ano até 2015 ano New Zealand. Dados de 1971 ano ausente. O número de observações reais por data: 44.
Fonte (nome):
Indicadores de desenvolvimento mundial
Fonte (organização):
World Bank national accounts data, and OECD National Accounts data files.
Categorias:
Economy & Growth
Foi atualizado:
23 abr 2017 ano
Indicadores de alterações dos valores ao longo dos anos
Mínimo:
20.443
1 jan 1981 ano
Máximo:
27.367
1 jan 1974 ano
Na data de observação
Valor
Mudança absoluta
A alteração em relação ao valor anterior
1 jan 1972 ano
25.248
+25.248
0.0%
1 jan 1973 ano
26.956
+1.708
6.77%
1 jan 1974 ano
27.367
+0.41
1.52%
1 jan 1975 ano
22.703
-4.664
-17.04%
1 jan 1976 ano
20.75
-1.953
-8.6%
1 jan 1977 ano
24.749
+3.999
19.27%
1 jan 1978 ano
23.648
-1.101
-4.45%
1 jan 1979 ano
22.917
-0.731
-3.09%
1 jan 1980 ano
22.107
-0.81
-3.54%
1 jan 1981 ano
20.443
-1.664
-7.53%
1 jan 1982 ano
22.242
+1.799
8.8%
1 jan 1983 ano
23.507
+1.265
5.69%
1 jan 1984 ano
25.676
+2.169
9.23%
1 jan 1985 ano
26.441
+0.765
2.98%
1 jan 1986 ano
24.895
-1.545
-5.84%
1 jan 1987 ano
25.612
+0.716
2.88%
1 jan 1988 ano
24.869
-0.742
-2.9%
1 jan 1989 ano
25.073
+0.203
0.82%
1 jan 1990 ano
24.093
-0.979
-3.91%
1 jan 1991 ano
21.386
-2.707
-11.24%
1 jan 1992 ano
21.232
-0.155
-0.72%
1 jan 1993 ano
21.816
+0.584
2.75%
1 jan 1994 ano
24.876
+3.061
14.03%
1 jan 1995 ano
25.323
+0.447
1.8%
1 jan 1996 ano
25.526
+0.203
0.8%
1 jan 1997 ano
24.727
-0.799
-3.13%
1 jan 1998 ano
24.323
-0.404
-1.63%
1 jan 1999 ano
22.15
-2.173
-8.93%
1 jan 2000 ano
23.729
+1.579
7.13%
1 jan 2001 ano
25.008
+1.278
5.39%
1 jan 2002 ano
26.58
+1.573
6.29%
1 jan 2003 ano
25.784
-0.796
-2.99%
1 jan 2004 ano
25.893
+0.109
0.42%
1 jan 2005 ano
25.568
-0.325
-1.25%
1 jan 2006 ano
23.972
-1.596
-6.24%
1 jan 2007 ano
23.359
-0.613
-2.56%
1 jan 2008 ano
24.874
+1.515
6.49%
1 jan 2009 ano
22.428
-2.446
-9.83%
1 jan 2010 ano
21.981
-0.447
-1.99%
1 jan 2011 ano
22.377
+0.396
1.8%
1 jan 2012 ano
21.992
-0.386
-1.72%
1 jan 2013 ano
21.71
-0.282
-1.28%
1 jan 2014 ano
23.163
+1.453
6.69%
1 jan 2015 ano
23.349
+0.186
0.8%
Classificação de países por estatísticas atuais por anos


Comentários: