29
/pt/
pt
AIzaSyAYiBZKx7MnpbEhh9jyipgxe19OcubqV5w
April 1, 2024
244622
Somalia
SOM
true
2
1
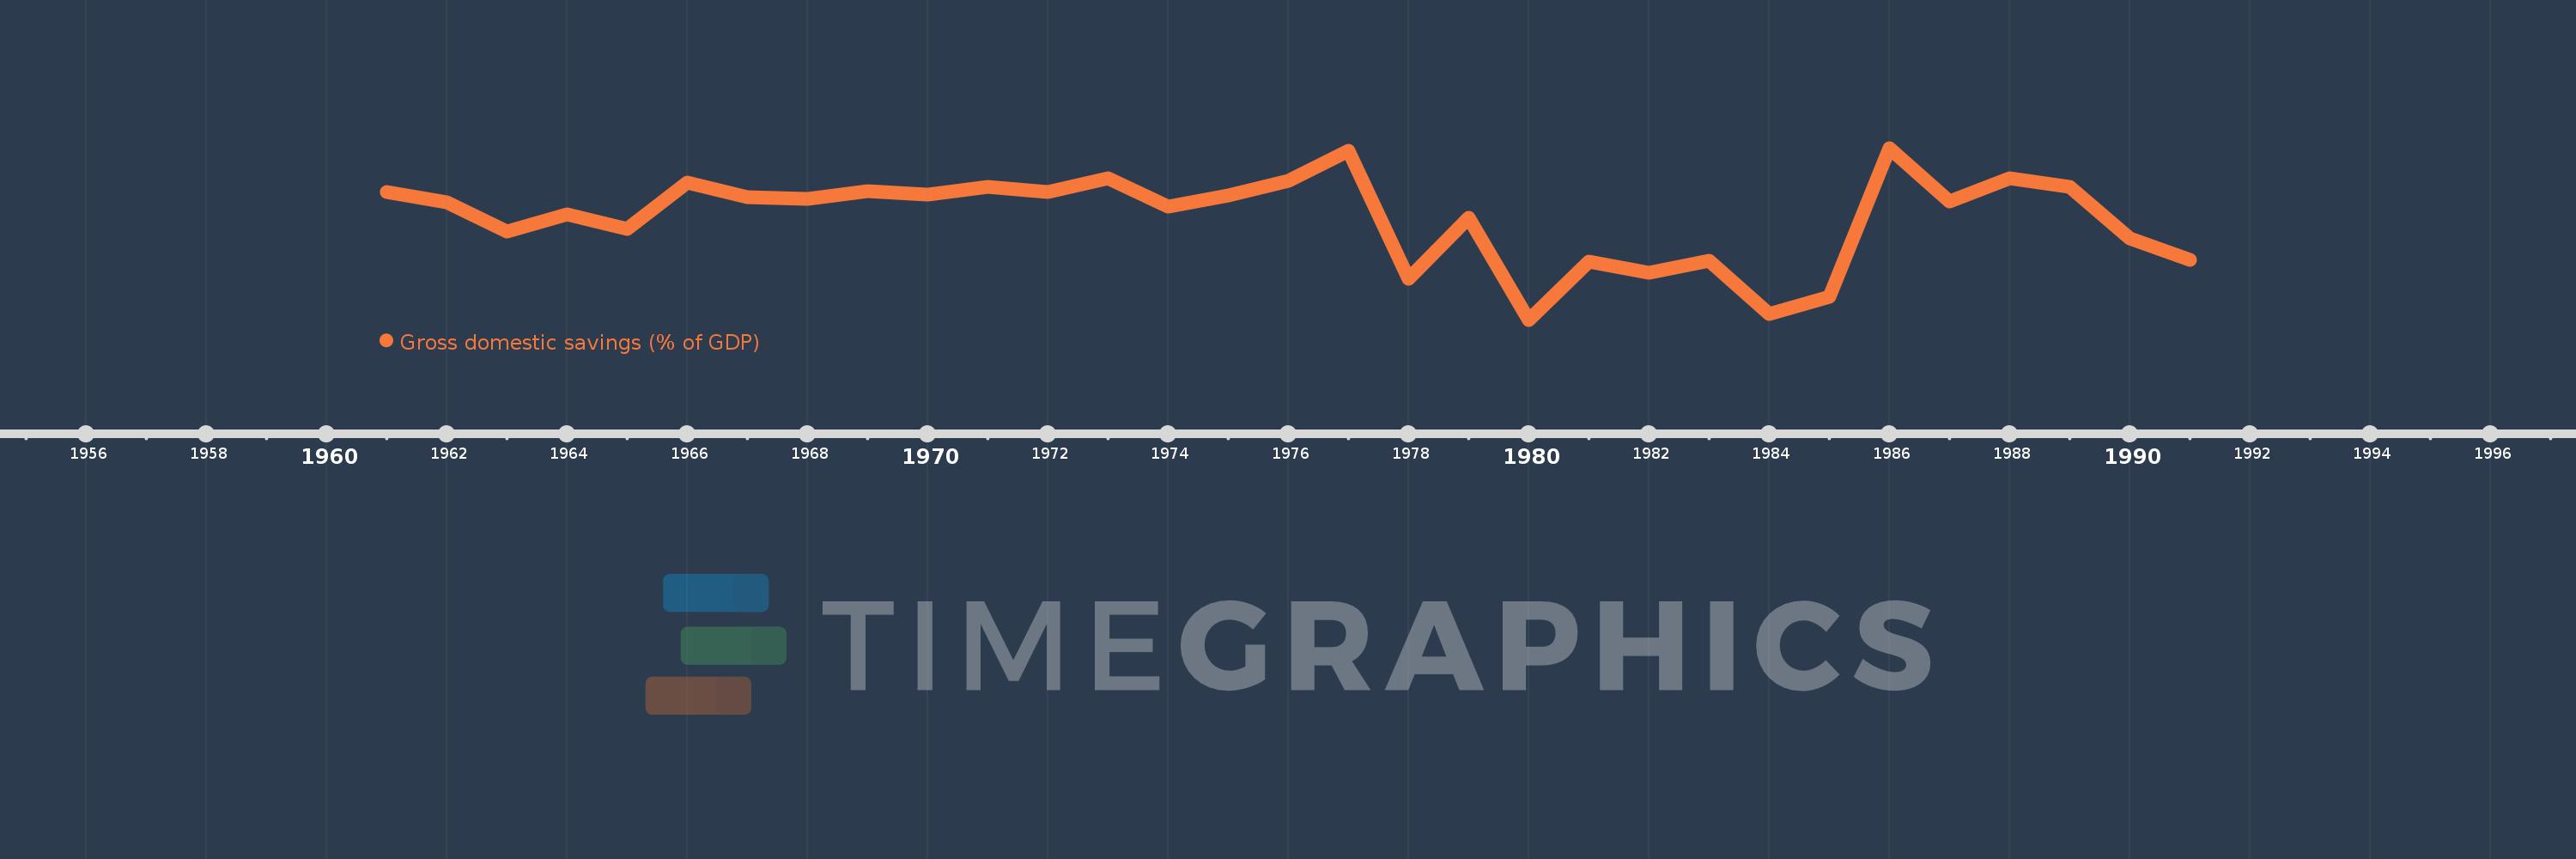
Gross domestic savings (% of GDP)
1991,1990,1989,1988,1987,1986,1985,1984,1983,1982,1981,1980,1979,1978,1977,1976,1975,1974,1973,1972,1971,1970,1969,1968,1967,1966,1965,1964,1963,1962,1961
Estas estatísticas em outros países:
AfghanistanAlbaniaAlgeriaAngolaAntigua and BarbudaArab WorldArgentinaArmeniaArubaAustraliaAustriaAzerbaijanBahamas, TheBahrainBangladeshBarbadosBelarusBelgiumBelizeBeninBermudaBhutanBoliviaBosnia and HerzegovinaBotswanaBrazilBrunei DarussalamBulgariaBurkina FasoBurundiCabo VerdeCambodiaCameroonCanadaCaribbean small statesCentral African RepublicCentral Europe and the BalticsChadChileChinaColombiaComorosCongo, Dem. Rep.Congo, Rep.Costa RicaCote d'IvoireCroatiaCubaCyprusCzech RepublicDenmarkDjiboutiDominicaDominican RepublicEarly-demographic dividendEast Asia & PacificEast Asia & Pacific (excluding high income)East Asia & Pacific (IDA & IBRD countries)EcuadorEgypt, Arab Rep.El SalvadorEquatorial GuineaEritreaEstoniaEthiopiaEuro areaEurope & Central AsiaEurope & Central Asia (excluding high income)Europe & Central Asia (IDA & IBRD countries)European UnionFaroe IslandsFijiFinlandFragile and conflict affected situationsFranceGabonGambia, TheGeorgiaGermanyGhanaGreeceGrenadaGuatemalaGuineaGuinea-BissauGuyanaHaitiHeavily indebted poor countries (HIPC)High incomeHondurasHong Kong SAR, ChinaHungaryIBRD onlyIcelandIDA & IBRD totalIDA blendIDA onlyIDA totalIndiaIndonesiaIran, Islamic Rep.IraqIrelandIsraelItalyJamaicaJapanJordanKazakhstanKenyaKiribatiKorea, Rep.KosovoKuwaitKyrgyz RepublicLao PDRLate-demographic dividendLatin America & Caribbean Latin America & Caribbean (excluding high income)Latin America & the Caribbean (IDA & IBRD countries)LatviaLeast developed countries: UN classificationLebanonLesothoLiberiaLibyaLithuaniaLow & middle incomeLow incomeLower middle incomeLuxembourgMacao SAR, ChinaMacedonia, FYRMadagascarMalawiMalaysiaMaldivesMaliMaltaMauritaniaMauritiusMexicoMicronesia, Fed. Sts.Middle East & North AfricaMiddle East & North Africa (excluding high income)Middle East & North Africa (IDA & IBRD countries)Middle incomeMoldovaMongoliaMontenegroMoroccoMozambiqueNamibiaNepalNetherlandsNew CaledoniaNew ZealandNicaraguaNigerNigeriaNorth AmericaNorwayOECD membersOmanOther small statesPacific island small statesPakistanPanamaPapua New GuineaParaguayPeruPhilippinesPolandPortugalPost-demographic dividendPre-demographic dividendPuerto RicoQatarRomaniaRussian FederationRwandaSaudi ArabiaSenegalSerbiaSeychellesSierra LeoneSingaporeSlovak RepublicSloveniaSmall statesSolomon IslandsSomaliaSouth AfricaSouth AsiaSouth Asia (IDA & IBRD)South SudanSpainSri LankaSt. Kitts and NevisSt. LuciaSt. Vincent and the GrenadinesSub-Saharan Africa Sub-Saharan Africa (excluding high income)Sub-Saharan Africa (IDA & IBRD countries)SudanSurinameSwazilandSwedenSwitzerlandSyrian Arab RepublicTajikistanTanzaniaThailandTimor-LesteTogoTongaTrinidad and TobagoTunisiaTurkeyTurkmenistanUgandaUkraineUnited Arab EmiratesUnited KingdomUnited StatesUpper middle incomeUruguayUzbekistanVanuatuVenezuela, RBVietnamWest Bank and GazaWorldYemen, Rep.ZambiaZimbabwe Linha do tempo:
Nesta escala de tempo está apresentado um gráfico de 1961 ano até 1991 ano Somalia. Dados de 1960 ano ausente. O número de observações reais por data: 31.
Fonte (nome):
Indicadores de desenvolvimento mundial
Fonte (organização):
World Bank national accounts data, and OECD National Accounts data files.
Categorias:
Economy & Growth
Foi atualizado:
23 abr 2017 ano
Indicadores de alterações dos valores ao longo dos anos
Mínimo:
-28.24
1 jan 1980 ano
Máximo:
16.824
1 jan 1986 ano
Na data de observação
Valor
Mudança absoluta
A alteração em relação ao valor anterior
1 jan 1961 ano
5.237
+5.237
0.0%
1 jan 1962 ano
2.549
-2.687
-51.32%
1 jan 1963 ano
-5.042
-7.591
-297.78%
1 jan 1964 ano
-0.499
+4.543
-90.11%
1 jan 1965 ano
-4.477
-3.978
797.64%
1 jan 1966 ano
7.703
+12.18
-272.06%
1 jan 1967 ano
3.835
-3.868
-50.22%
1 jan 1968 ano
3.42
-0.414
-10.81%
1 jan 1969 ano
5.547
+2.126
62.17%
1 jan 1970 ano
4.691
-0.856
-15.43%
1 jan 1971 ano
6.51
+1.819
38.77%
1 jan 1972 ano
5.296
-1.214
-18.64%
1 jan 1973 ano
8.762
+3.466
65.45%
1 jan 1974 ano
1.382
-7.38
-84.23%
1 jan 1975 ano
4.349
+2.967
214.78%
1 jan 1976 ano
8.108
+3.759
86.44%
1 jan 1977 ano
16.081
+7.973
98.34%
1 jan 1978 ano
-17.529
-33.61
-209.01%
1 jan 1979 ano
-1.577
+15.952
-91.0%
1 jan 1980 ano
-28.24
-26.663
1.69 mil%
1 jan 1981 ano
-12.912
+15.328
-54.28%
1 jan 1982 ano
-15.986
-3.075
23.81%
1 jan 1983 ano
-12.802
+3.184
-19.92%
1 jan 1984 ano
-26.637
-13.835
108.07%
1 jan 1985 ano
-22.291
+4.346
-16.32%
1 jan 1986 ano
16.824
+39.114
-175.47%
1 jan 1987 ano
2.768
-14.055
-83.55%
1 jan 1988 ano
8.777
+6.009
217.05%
1 jan 1989 ano
6.538
-2.239
-25.51%
1 jan 1990 ano
-6.914
-13.451
-205.76%
1 jan 1991 ano
-12.455
-5.541
80.14%
Classificação de países por estatísticas atuais por anos


Comentários: