29
/pt/
pt
AIzaSyAYiBZKx7MnpbEhh9jyipgxe19OcubqV5w
April 1, 2024
153589
Iceland
ISL
true
2
1
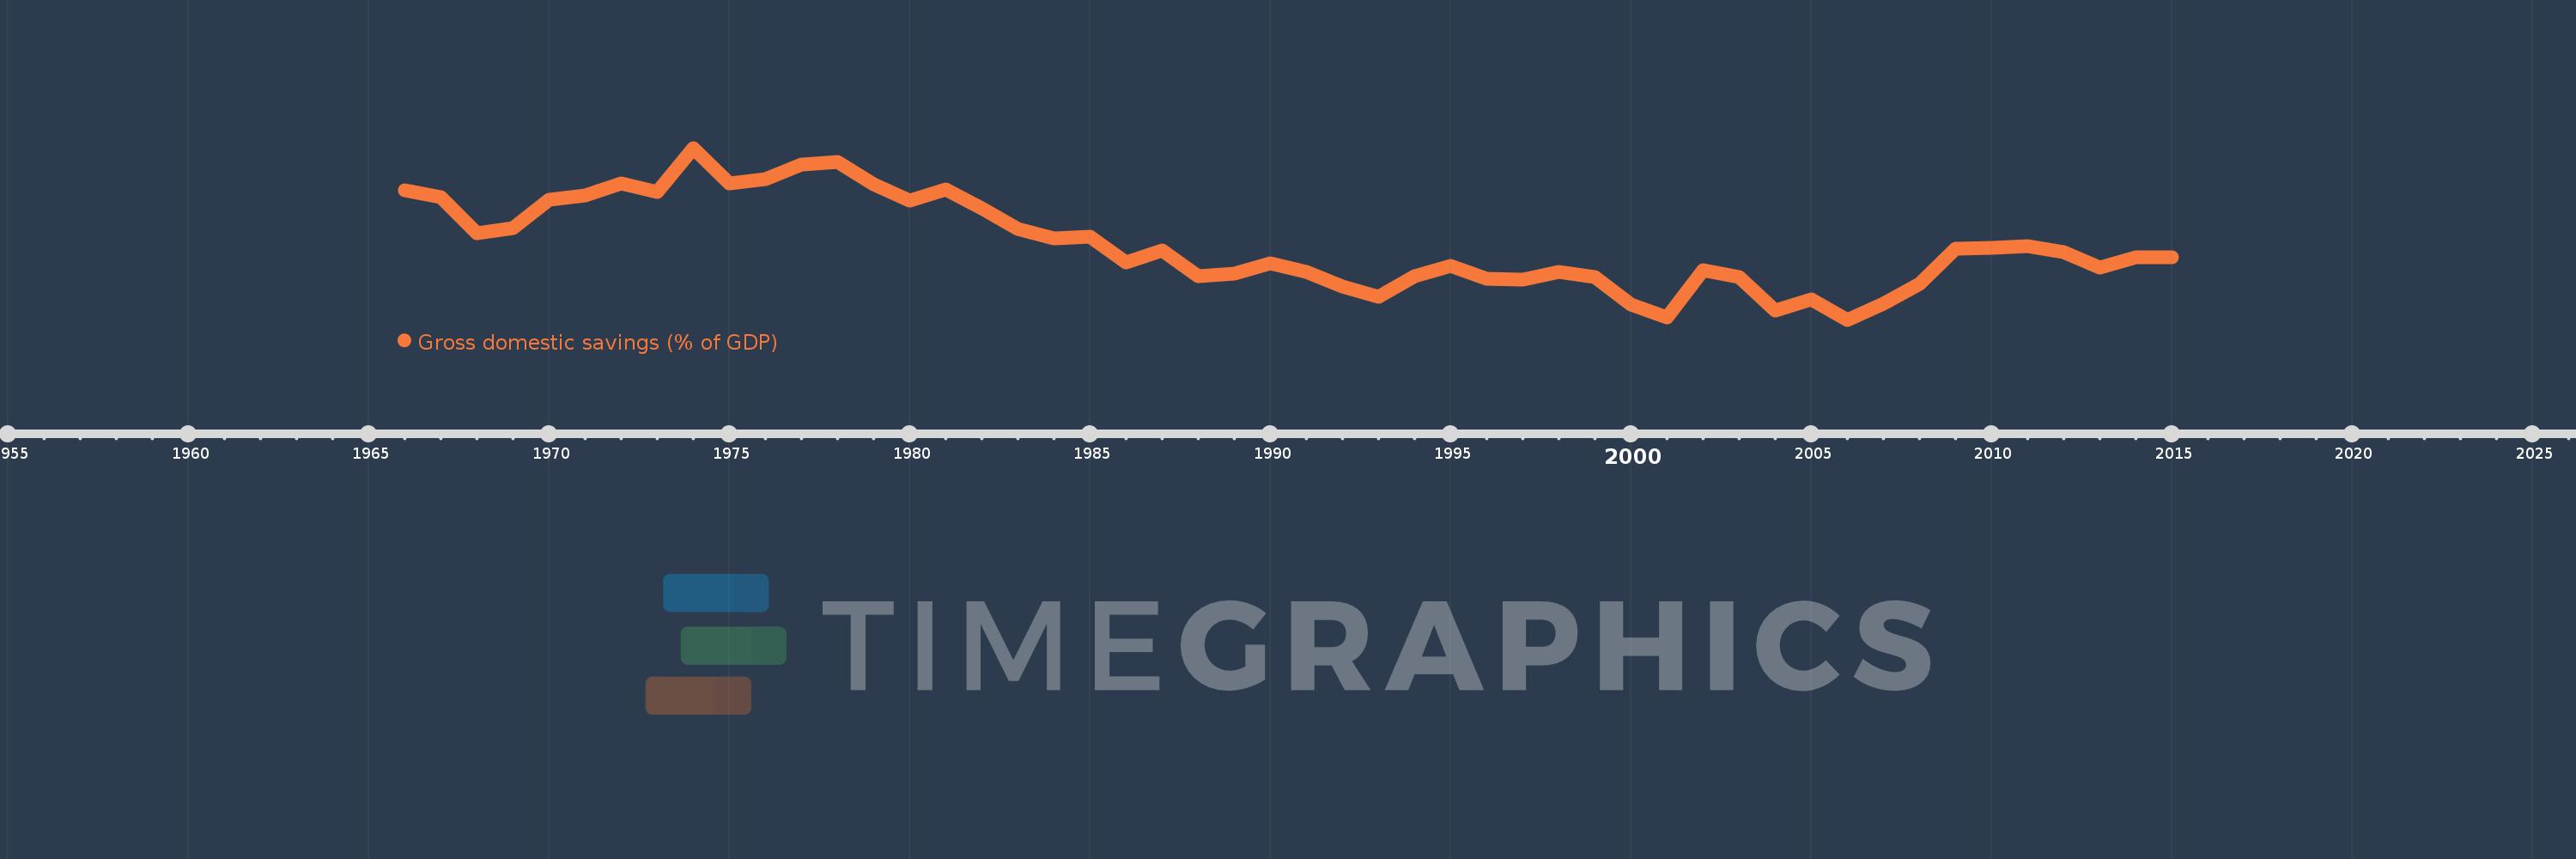
Gross domestic savings (% of GDP)
2015,2014,2013,2012,2011,2010,2009,2008,2007,2006,2005,2004,2003,2002,2001,2000,1999,1998,1997,1996,1995,1994,1993,1992,1991,1990,1989,1988,1987,1986,1985,1984,1983,1982,1981,1980,1979,1978,1977,1976,1975,1974,1973,1972,1971,1970,1969,1968,1967,1966
Estas estatísticas em outros países:
AfghanistanAlbaniaAlgeriaAngolaAntigua and BarbudaArab WorldArgentinaArmeniaArubaAustraliaAustriaAzerbaijanBahamas, TheBahrainBangladeshBarbadosBelarusBelgiumBelizeBeninBermudaBhutanBoliviaBosnia and HerzegovinaBotswanaBrazilBrunei DarussalamBulgariaBurkina FasoBurundiCabo VerdeCambodiaCameroonCanadaCaribbean small statesCentral African RepublicCentral Europe and the BalticsChadChileChinaColombiaComorosCongo, Dem. Rep.Congo, Rep.Costa RicaCote d'IvoireCroatiaCubaCyprusCzech RepublicDenmarkDjiboutiDominicaDominican RepublicEarly-demographic dividendEast Asia & PacificEast Asia & Pacific (excluding high income)East Asia & Pacific (IDA & IBRD countries)EcuadorEgypt, Arab Rep.El SalvadorEquatorial GuineaEritreaEstoniaEthiopiaEuro areaEurope & Central AsiaEurope & Central Asia (excluding high income)Europe & Central Asia (IDA & IBRD countries)European UnionFaroe IslandsFijiFinlandFragile and conflict affected situationsFranceGabonGambia, TheGeorgiaGermanyGhanaGreeceGrenadaGuatemalaGuineaGuinea-BissauGuyanaHaitiHeavily indebted poor countries (HIPC)High incomeHondurasHong Kong SAR, ChinaHungaryIBRD onlyIcelandIDA & IBRD totalIDA blendIDA onlyIDA totalIndiaIndonesiaIran, Islamic Rep.IraqIrelandIsraelItalyJamaicaJapanJordanKazakhstanKenyaKiribatiKorea, Rep.KosovoKuwaitKyrgyz RepublicLao PDRLate-demographic dividendLatin America & Caribbean Latin America & Caribbean (excluding high income)Latin America & the Caribbean (IDA & IBRD countries)LatviaLeast developed countries: UN classificationLebanonLesothoLiberiaLibyaLithuaniaLow & middle incomeLow incomeLower middle incomeLuxembourgMacao SAR, ChinaMacedonia, FYRMadagascarMalawiMalaysiaMaldivesMaliMaltaMauritaniaMauritiusMexicoMicronesia, Fed. Sts.Middle East & North AfricaMiddle East & North Africa (excluding high income)Middle East & North Africa (IDA & IBRD countries)Middle incomeMoldovaMongoliaMontenegroMoroccoMozambiqueNamibiaNepalNetherlandsNew CaledoniaNew ZealandNicaraguaNigerNigeriaNorth AmericaNorwayOECD membersOmanOther small statesPacific island small statesPakistanPanamaPapua New GuineaParaguayPeruPhilippinesPolandPortugalPost-demographic dividendPre-demographic dividendPuerto RicoQatarRomaniaRussian FederationRwandaSaudi ArabiaSenegalSerbiaSeychellesSierra LeoneSingaporeSlovak RepublicSloveniaSmall statesSolomon IslandsSomaliaSouth AfricaSouth AsiaSouth Asia (IDA & IBRD)South SudanSpainSri LankaSt. Kitts and NevisSt. LuciaSt. Vincent and the GrenadinesSub-Saharan Africa Sub-Saharan Africa (excluding high income)Sub-Saharan Africa (IDA & IBRD countries)SudanSurinameSwazilandSwedenSwitzerlandSyrian Arab RepublicTajikistanTanzaniaThailandTimor-LesteTogoTongaTrinidad and TobagoTunisiaTurkeyTurkmenistanUgandaUkraineUnited Arab EmiratesUnited KingdomUnited StatesUpper middle incomeUruguayUzbekistanVanuatuVenezuela, RBVietnamWest Bank and GazaWorldYemen, Rep.ZambiaZimbabwe Linha do tempo:
Nesta escala de tempo está apresentado um gráfico de 1966 ano até 2015 ano Iceland. Dados de 1965 ano ausente. O número de observações reais por data: 50.
Fonte (nome):
Indicadores de desenvolvimento mundial
Fonte (organização):
World Bank national accounts data, and OECD National Accounts data files.
Categorias:
Economy & Growth
Foi atualizado:
23 abr 2017 ano
Indicadores de alterações dos valores ao longo dos anos
Mínimo:
17.397
1 jan 2006 ano
Máximo:
32.948
1 jan 1974 ano
Na data de observação
Valor
Mudança absoluta
A alteração em relação ao valor anterior
1 jan 1966 ano
29.147
+29.147
0.0%
1 jan 1967 ano
28.472
-0.675
-2.32%
1 jan 1968 ano
25.209
-3.263
-11.46%
1 jan 1969 ano
25.692
+0.483
1.92%
1 jan 1970 ano
28.298
+2.606
10.14%
1 jan 1971 ano
28.623
+0.325
1.15%
1 jan 1972 ano
29.762
+1.139
3.98%
1 jan 1973 ano
28.977
-0.785
-2.64%
1 jan 1974 ano
32.948
+3.971
13.7%
1 jan 1975 ano
29.747
-3.201
-9.72%
1 jan 1976 ano
30.124
+0.377
1.27%
1 jan 1977 ano
31.428
+1.304
4.33%
1 jan 1978 ano
31.654
+0.226
0.72%
1 jan 1979 ano
29.657
-1.997
-6.31%
1 jan 1980 ano
28.181
-1.476
-4.98%
1 jan 1981 ano
29.199
+1.018
3.61%
1 jan 1982 ano
27.473
-1.726
-5.91%
1 jan 1983 ano
25.649
-1.824
-6.64%
1 jan 1984 ano
24.784
-0.864
-3.37%
1 jan 1985 ano
24.953
+0.169
0.68%
1 jan 1986 ano
22.564
-2.389
-9.57%
1 jan 1987 ano
23.642
+1.077
4.77%
1 jan 1988 ano
21.313
-2.328
-9.85%
1 jan 1989 ano
21.601
+0.287
1.35%
1 jan 1990 ano
22.482
+0.882
4.08%
1 jan 1991 ano
21.741
-0.742
-3.3%
1 jan 1992 ano
20.395
-1.346
-6.19%
1 jan 1993 ano
19.444
-0.951
-4.66%
1 jan 1994 ano
21.323
+1.88
9.67%
1 jan 1995 ano
22.286
+0.963
4.52%
1 jan 1996 ano
21.142
-1.144
-5.13%
1 jan 1997 ano
21.017
-0.125
-0.59%
1 jan 1998 ano
21.735
+0.718
3.41%
1 jan 1999 ano
21.293
-0.442
-2.03%
1 jan 2000 ano
18.773
-2.52
-11.83%
1 jan 2001 ano
17.641
-1.132
-6.03%
1 jan 2002 ano
21.888
+4.246
24.07%
1 jan 2003 ano
21.261
-0.627
-2.87%
1 jan 2004 ano
18.198
-3.063
-14.41%
1 jan 2005 ano
19.261
+1.063
5.84%
1 jan 2006 ano
17.397
-1.865
-9.68%
1 jan 2007 ano
18.848
+1.452
8.35%
1 jan 2008 ano
20.661
+1.813
9.62%
1 jan 2009 ano
23.808
+3.146
15.23%
1 jan 2010 ano
23.919
+0.112
0.47%
1 jan 2011 ano
24.087
+0.168
0.7%
1 jan 2012 ano
23.544
-0.542
-2.25%
1 jan 2013 ano
22.15
-1.394
-5.92%
1 jan 2014 ano
23.075
+0.925
4.18%
1 jan 2015 ano
23.051
-0.023
-0.1%
Classificação de países por estatísticas atuais por anos


Comentários: