29
/pt/
pt
AIzaSyAYiBZKx7MnpbEhh9jyipgxe19OcubqV5w
April 1, 2024
267260
Trinidad and Tobago
TTO
true
2
1
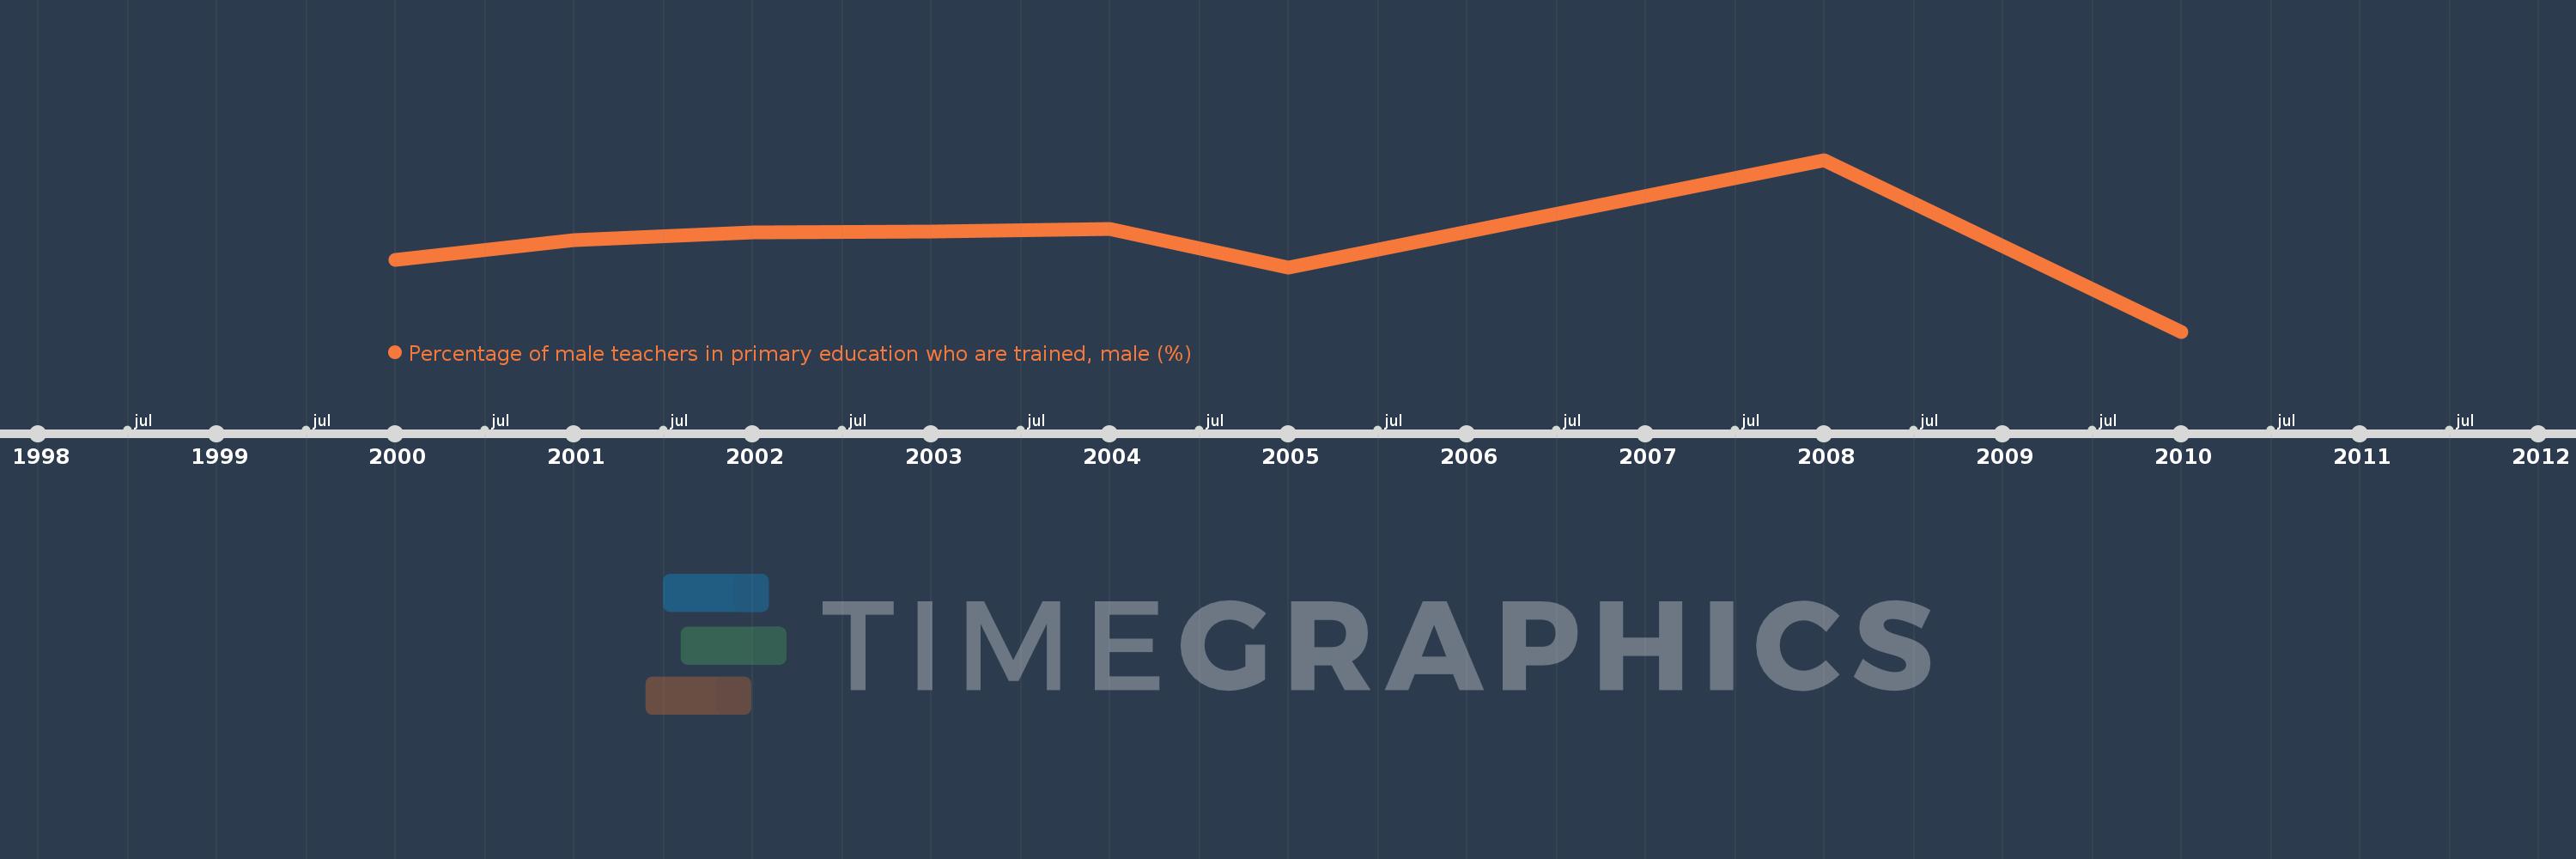
Percentage of male teachers in primary education who are trained, male (%)
2010,2008,2005,2004,2003,2002,2001,2000
Estas estatísticas em outros países:
Linha do tempo:
Nesta escala de tempo está apresentado um gráfico de 2000 ano até 2010 ano Trinidad and Tobago. Dados de 1999 ano ausente. O número de observações reais por data: 8.
Fonte (nome):
Indicadores de desenvolvimento mundial
Fonte (organização):
United Nations Educational, Scientific, and Cultural Organization (UNESCO) Institute for Statistics.
Categorias:
Education, Gender
Foi atualizado:
23 abr 2017 ano
Indicadores de alterações dos valores ao longo dos anos
Mínimo:
58.976
1 jan 2010 ano
Máximo:
94.961
1 jan 2008 ano
Na data de observação
Valor
Mudança absoluta
A alteração em relação ao valor anterior
1 jan 2000 ano
73.933
+73.933
0.0%
1 jan 2001 ano
78.19
+4.257
5.76%
1 jan 2002 ano
79.691
+1.501
1.92%
1 jan 2003 ano
79.953
+0.262
0.33%
1 jan 2004 ano
80.538
+0.585
0.73%
1 jan 2005 ano
72.301
-8.237
-10.23%
1 jan 2008 ano
94.961
+22.659
31.34%
1 jan 2010 ano
58.976
-35.985
-37.89%
Classificação de países por estatísticas atuais por anos


Comentários: