29
/pt/
pt
AIzaSyAYiBZKx7MnpbEhh9jyipgxe19OcubqV5w
April 1, 2024
251178
St. Lucia
LCA
true
2
1
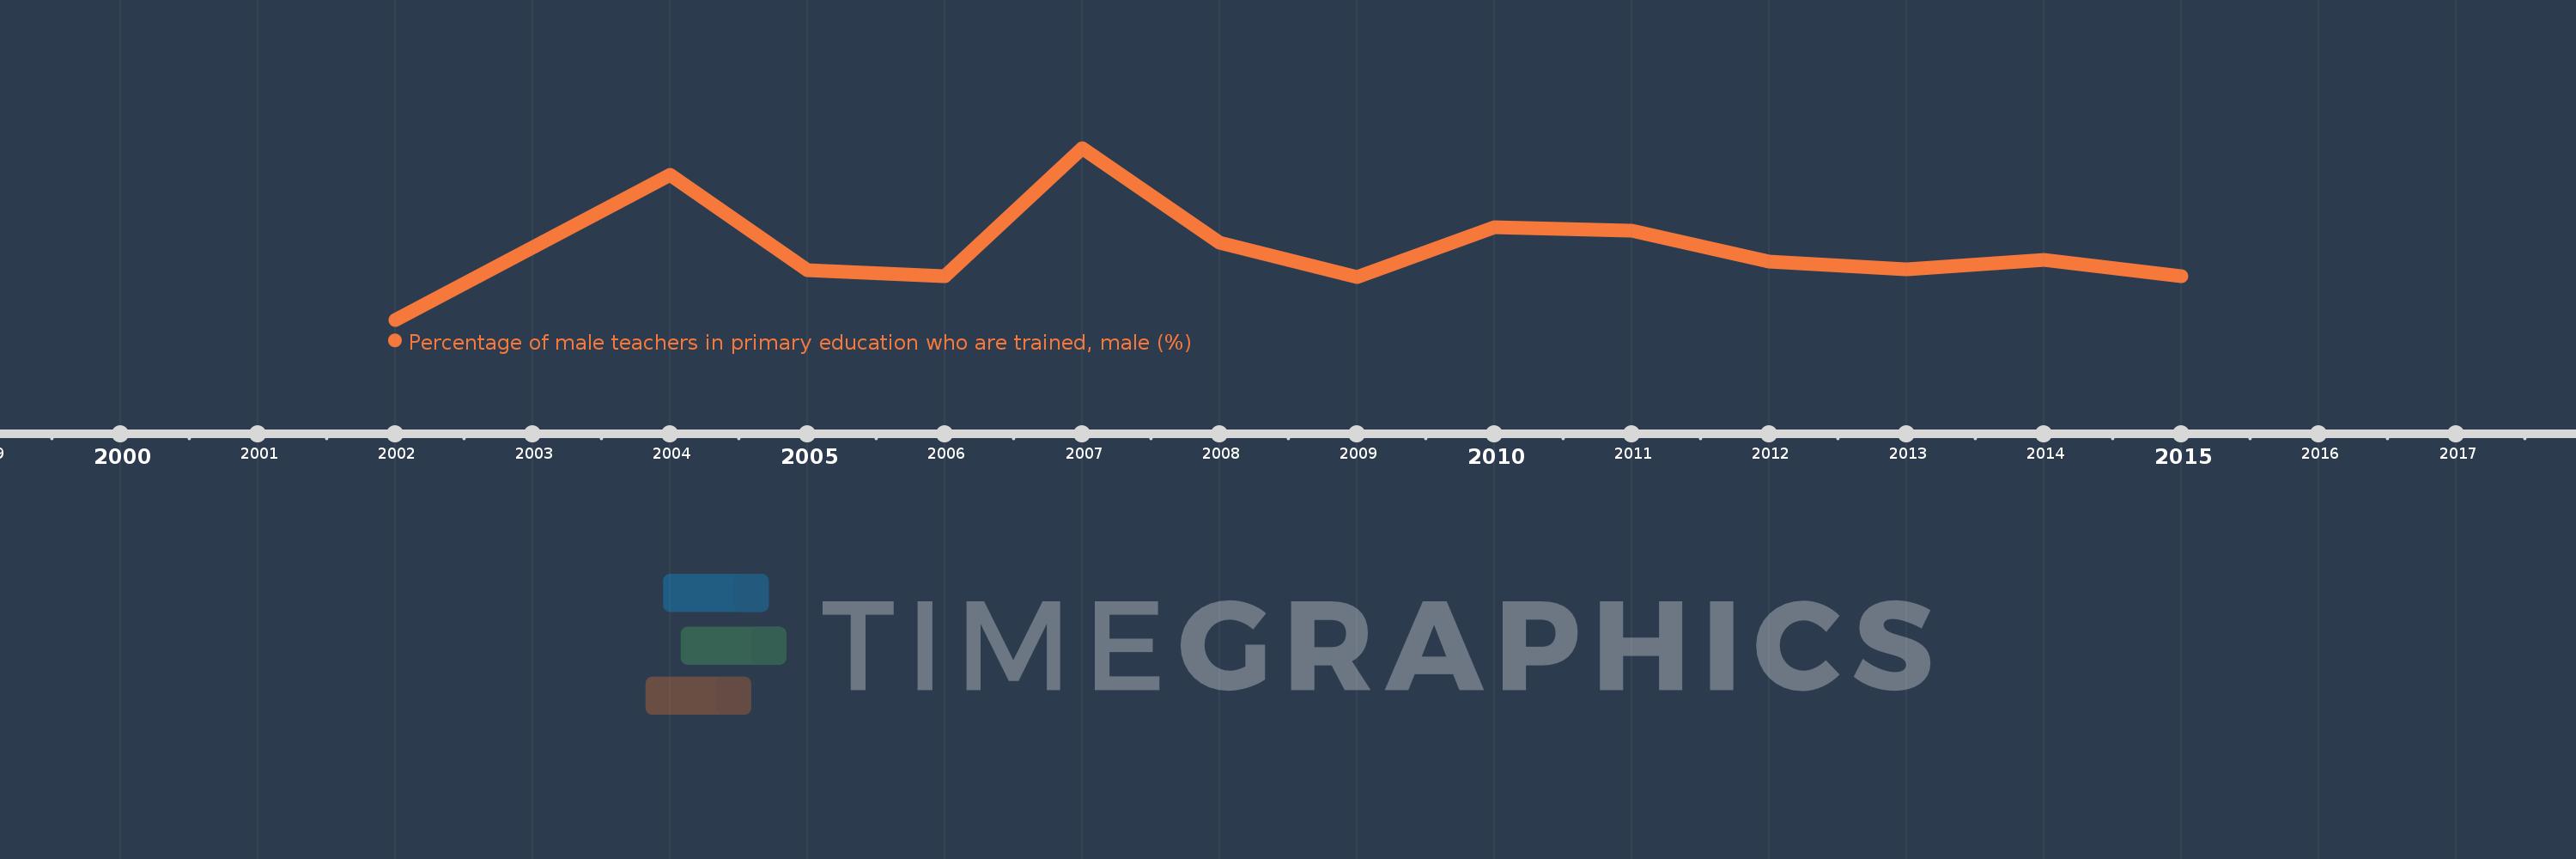
Percentage of male teachers in primary education who are trained, male (%)
2015,2014,2013,2012,2011,2010,2009,2008,2007,2006,2005,2004,2002
Estas estatísticas em outros países:
Linha do tempo:
Nesta escala de tempo está apresentado um gráfico de 2002 ano até 2015 ano St. Lucia. Dados de 2001 ano ausente. O número de observações reais por data: 13.
Fonte (nome):
Indicadores de desenvolvimento mundial
Fonte (organização):
United Nations Educational, Scientific, and Cultural Organization (UNESCO) Institute for Statistics.
Categorias:
Education, Gender
Foi atualizado:
23 abr 2017 ano
Indicadores de alterações dos valores ao longo dos anos
Mínimo:
64.444
1 jan 2002 ano
Máximo:
97.902
1 jan 2007 ano
Na data de observação
Valor
Mudança absoluta
A alteração em relação ao valor anterior
1 jan 2002 ano
64.444
+64.444
0.0%
1 jan 2004 ano
92.638
+28.194
43.75%
1 jan 2005 ano
74.126
-18.512
-19.98%
1 jan 2006 ano
72.848
-1.278
-1.72%
1 jan 2007 ano
97.902
+25.054
34.39%
1 jan 2008 ano
79.508
-18.394
-18.79%
1 jan 2009 ano
72.794
-6.714
-8.44%
1 jan 2010 ano
82.54
+9.746
13.39%
1 jan 2011 ano
81.752
-0.788
-0.95%
1 jan 2012 ano
75.714
-6.038
-7.39%
1 jan 2013 ano
74.286
-1.429
-1.89%
1 jan 2014 ano
76.119
+1.834
2.47%
1 jan 2015 ano
72.857
-3.262
-4.29%
Classificação de países por estatísticas atuais por anos


Comentários: