29
/pt/
pt
AIzaSyAYiBZKx7MnpbEhh9jyipgxe19OcubqV5w
April 1, 2024
207218
Nepal
NPL
true
2
1
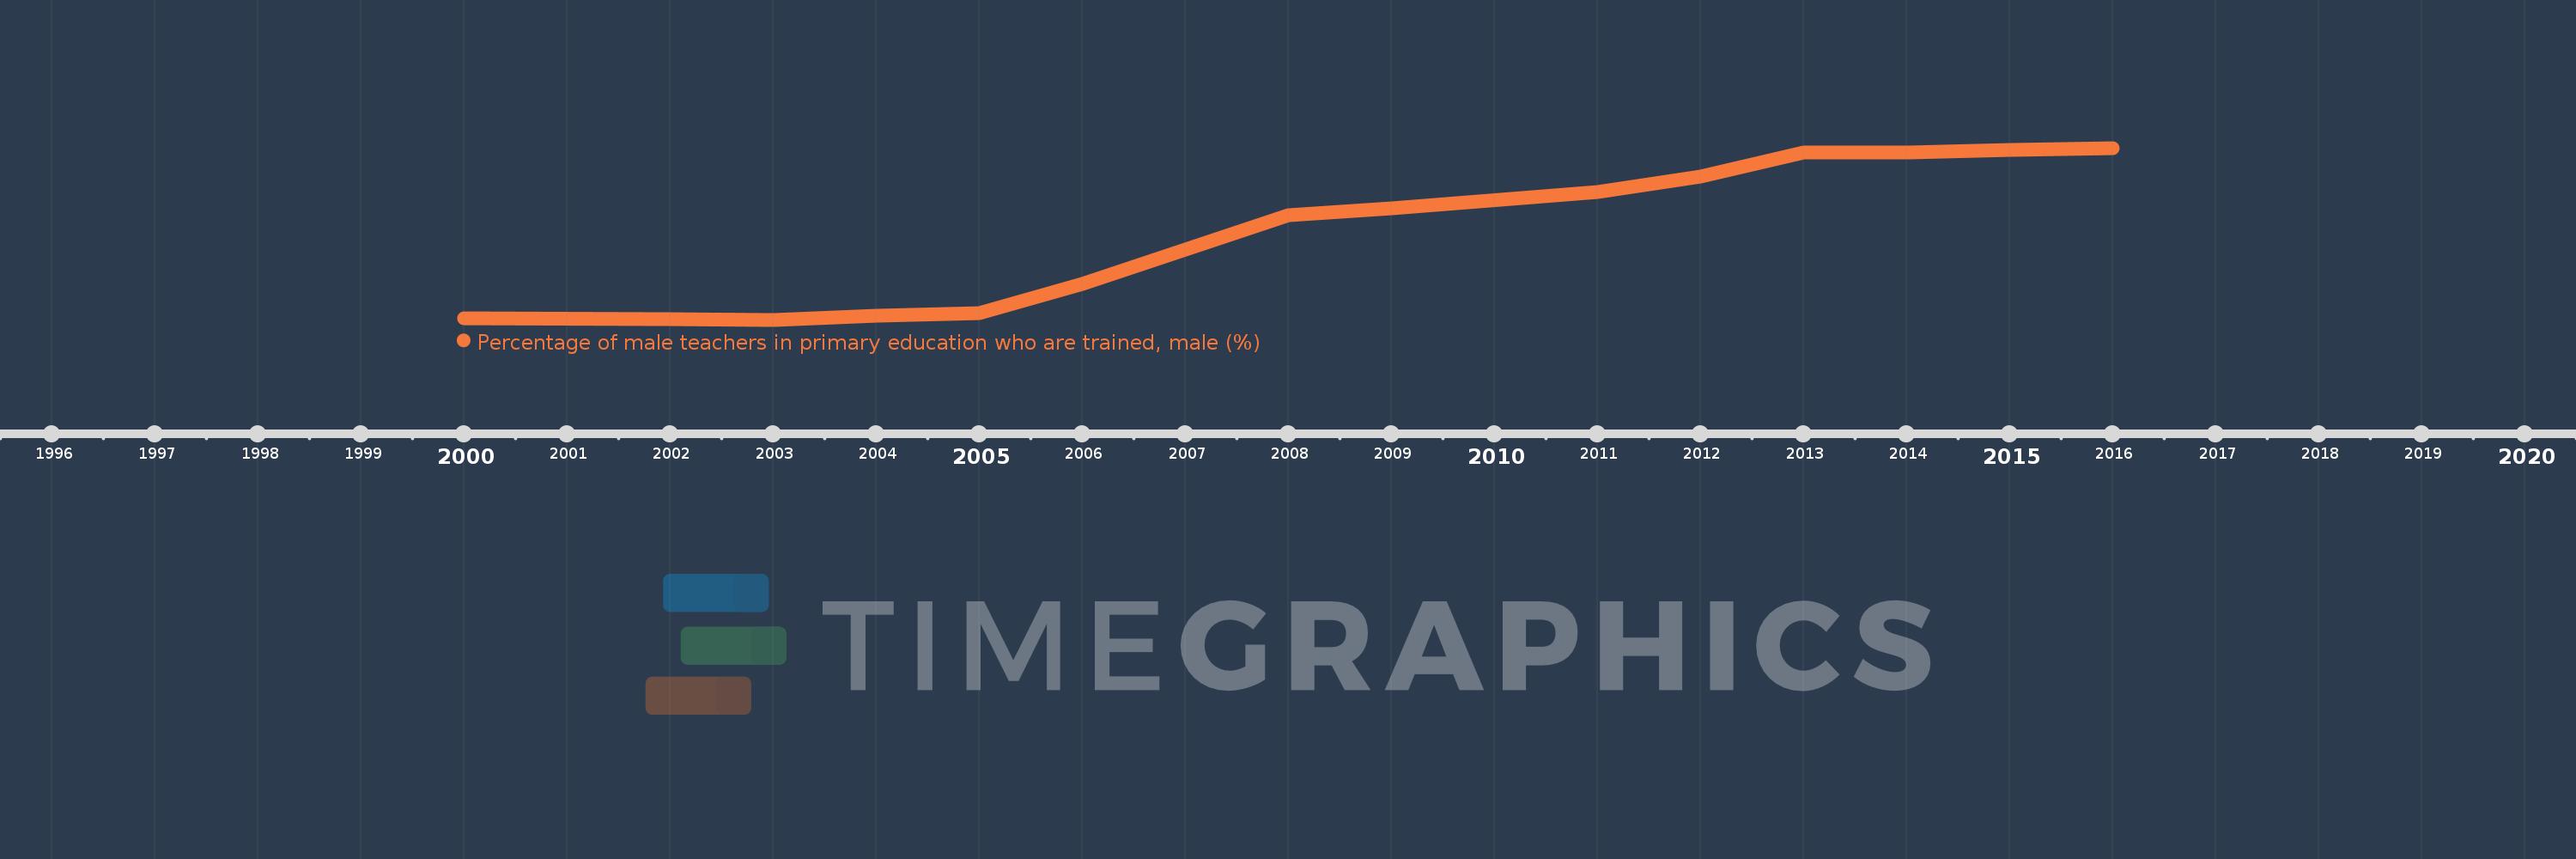
Percentage of male teachers in primary education who are trained, male (%)
2016,2015,2014,2013,2012,2011,2009,2008,2006,2005,2004,2003,2002,2000
Estas estatísticas em outros países:
Linha do tempo:
Nesta escala de tempo está apresentado um gráfico de 2000 ano até 2016 ano Nepal. Dados de 1999 ano ausente. O número de observações reais por data: 14.
Fonte (nome):
Indicadores de desenvolvimento mundial
Fonte (organização):
United Nations Educational, Scientific, and Cultural Organization (UNESCO) Institute for Statistics.
Categorias:
Education, Gender
Foi atualizado:
23 abr 2017 ano
Indicadores de alterações dos valores ao longo dos anos
Mínimo:
15.508
1 jan 2003 ano
Máximo:
94.641
1 jan 2016 ano
Na data de observação
Valor
Mudança absoluta
A alteração em relação ao valor anterior
1 jan 2000 ano
16.105
+16.105
0.0%
1 jan 2002 ano
15.98
-0.125
-0.77%
1 jan 2003 ano
15.508
-0.472
-2.95%
1 jan 2004 ano
17.324
+1.816
11.71%
1 jan 2005 ano
18.455
+1.131
6.53%
1 jan 2006 ano
32.008
+13.553
73.44%
1 jan 2008 ano
63.489
+31.48
98.35%
1 jan 2009 ano
66.841
+3.353
5.28%
1 jan 2011 ano
74.458
+7.616
11.39%
1 jan 2012 ano
81.37
+6.913
9.28%
1 jan 2013 ano
92.738
+11.368
13.97%
1 jan 2014 ano
92.38
-0.358
-0.39%
1 jan 2015 ano
93.928
+1.548
1.68%
1 jan 2016 ano
94.641
+0.714
0.76%
Classificação de países por estatísticas atuais por anos


Comentários: