29
/pt/
pt
AIzaSyAYiBZKx7MnpbEhh9jyipgxe19OcubqV5w
April 1, 2024
26610
Early-demographic dividend
EAR
false
2
1
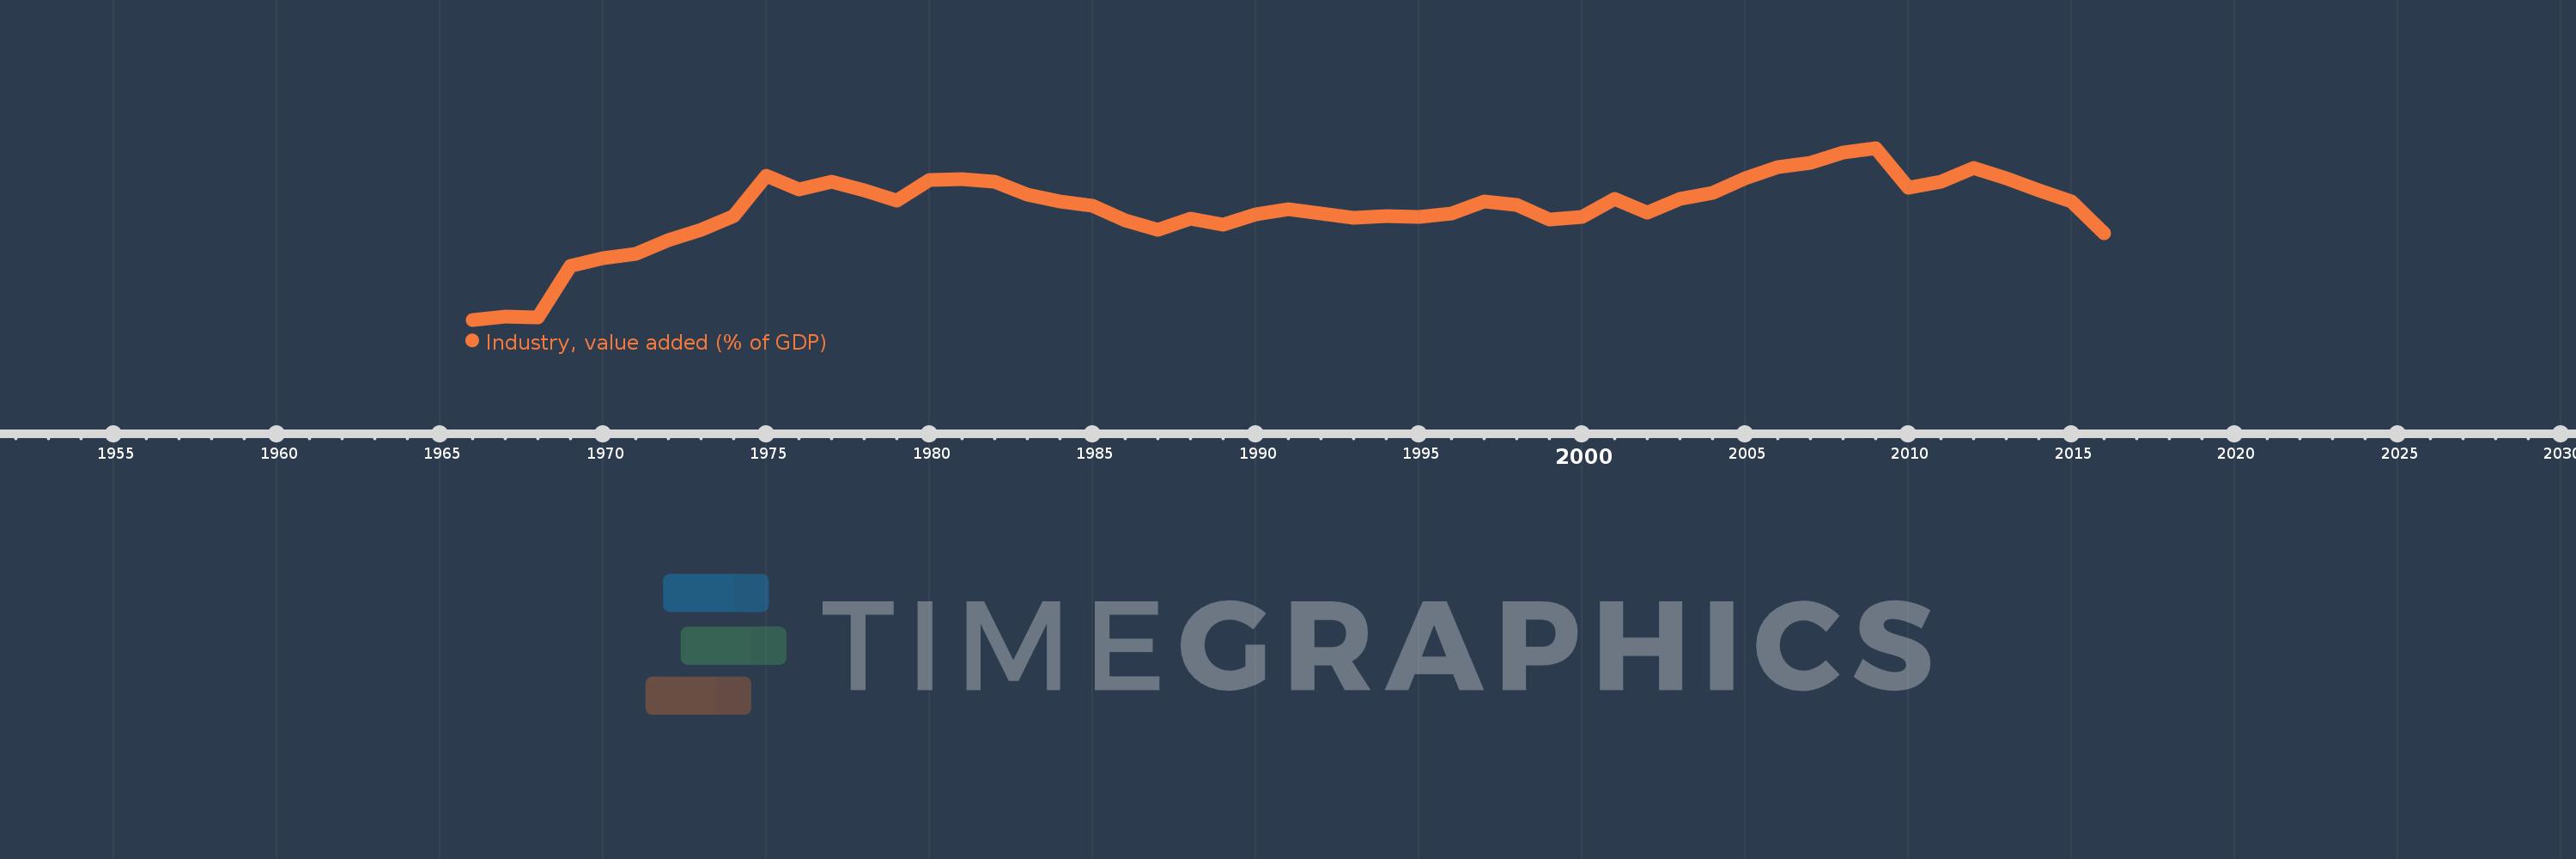
Industry, value added (% of GDP)
2016,2015,2014,2013,2012,2011,2010,2009,2008,2007,2006,2005,2004,2003,2002,2001,2000,1999,1998,1997,1996,1995,1994,1993,1992,1991,1990,1989,1988,1987,1986,1985,1984,1983,1982,1981,1980,1979,1978,1977,1976,1975,1974,1973,1972,1971,1970,1969,1968,1967,1966
Estas estatísticas em outros países:
AfghanistanAlbaniaAlgeriaAndorraAngolaAntigua and BarbudaArab WorldArgentinaArmeniaArubaAustraliaAustriaAzerbaijanBahamas, TheBahrainBangladeshBarbadosBelarusBelgiumBelizeBeninBermudaBhutanBoliviaBosnia and HerzegovinaBotswanaBrazilBrunei DarussalamBulgariaBurkina FasoBurundiCabo VerdeCambodiaCameroonCanadaCaribbean small statesCayman IslandsCentral African RepublicCentral Europe and the BalticsChadChileChinaColombiaComorosCongo, Dem. Rep.Congo, Rep.Costa RicaCote d'IvoireCroatiaCubaCyprusCzech RepublicDenmarkDjiboutiDominicaDominican RepublicEarly-demographic dividendEast Asia & PacificEast Asia & Pacific (excluding high income)East Asia & Pacific (IDA & IBRD countries)EcuadorEgypt, Arab Rep.El SalvadorEquatorial GuineaEritreaEstoniaEthiopiaEuro areaEurope & Central AsiaEurope & Central Asia (excluding high income)Europe & Central Asia (IDA & IBRD countries)European UnionFijiFinlandFragile and conflict affected situationsFranceGabonGambia, TheGeorgiaGermanyGhanaGreeceGrenadaGuatemalaGuineaGuinea-BissauGuyanaHeavily indebted poor countries (HIPC)High incomeHondurasHong Kong SAR, ChinaHungaryIBRD onlyIcelandIDA & IBRD totalIDA blendIDA onlyIDA totalIndiaIndonesiaIran, Islamic Rep.IrelandItalyJamaicaJapanJordanKazakhstanKenyaKiribatiKorea, Rep.KosovoKuwaitKyrgyz RepublicLao PDRLate-demographic dividendLatin America & Caribbean Latin America & Caribbean (excluding high income)Latin America & the Caribbean (IDA & IBRD countries)LatviaLeast developed countries: UN classificationLebanonLesothoLibyaLiechtensteinLithuaniaLow & middle incomeLow incomeLower middle incomeLuxembourgMacao SAR, ChinaMacedonia, FYRMadagascarMalawiMalaysiaMaldivesMaliMaltaMarshall IslandsMauritaniaMauritiusMexicoMicronesia, Fed. Sts.Middle East & North AfricaMiddle East & North Africa (excluding high income)Middle East & North Africa (IDA & IBRD countries)Middle incomeMoldovaMongoliaMontenegroMoroccoMozambiqueMyanmarNamibiaNepalNetherlandsNew CaledoniaNew ZealandNicaraguaNigerNigeriaNorth AmericaNorwayOECD membersOmanOther small statesPacific island small statesPakistanPalauPanamaPapua New GuineaParaguayPeruPhilippinesPolandPortugalPost-demographic dividendPre-demographic dividendPuerto RicoQatarRomaniaRussian FederationRwandaSao Tome and PrincipeSaudi ArabiaSenegalSerbiaSeychellesSierra LeoneSingaporeSlovak RepublicSloveniaSmall statesSolomon IslandsSomaliaSouth AfricaSouth AsiaSouth Asia (IDA & IBRD)SpainSri LankaSt. Kitts and NevisSt. LuciaSt. Vincent and the GrenadinesSub-Saharan Africa Sub-Saharan Africa (excluding high income)Sub-Saharan Africa (IDA & IBRD countries)SudanSurinameSwazilandSwedenSwitzerlandSyrian Arab RepublicTajikistanTanzaniaThailandTimor-LesteTogoTongaTrinidad and TobagoTunisiaTurkeyTurkmenistanTuvaluUgandaUkraineUnited KingdomUnited StatesUpper middle incomeUruguayUzbekistanVanuatuVenezuela, RBVietnamWest Bank and GazaWorldYemen, Rep.ZambiaZimbabwe Linha do tempo:
Nesta escala de tempo está apresentado um gráfico de 1966 ano até 2016 ano Early-demographic dividend. Dados de 1965 ano ausente. O número de observações reais por data: 51.
Fonte (nome):
Indicadores de desenvolvimento mundial
Fonte (organização):
World Bank national accounts data, and OECD National Accounts data files.
Categorias:
Economy & Growth
Foi atualizado:
23 abr 2017 ano
Indicadores de alterações dos valores ao longo dos anos
Mínimo:
25.574
1 jan 1966 ano
Máximo:
38.73
1 jan 2009 ano
Na data de observação
Valor
Mudança absoluta
A alteração em relação ao valor anterior
1 jan 1966 ano
25.574
+25.574
0.0%
1 jan 1967 ano
25.798
+0.224
0.88%
1 jan 1968 ano
25.73
-0.068
-0.26%
1 jan 1969 ano
29.723
+3.993
15.52%
1 jan 1970 ano
30.265
+0.542
1.82%
1 jan 1971 ano
30.627
+0.363
1.2%
1 jan 1972 ano
31.686
+1.058
3.46%
1 jan 1973 ano
32.485
+0.799
2.52%
1 jan 1974 ano
33.482
+0.997
3.07%
1 jan 1975 ano
36.612
+3.129
9.35%
1 jan 1976 ano
35.558
-1.054
-2.88%
1 jan 1977 ano
36.158
+0.6
1.69%
1 jan 1978 ano
35.503
-0.655
-1.81%
1 jan 1979 ano
34.729
-0.774
-2.18%
1 jan 1980 ano
36.294
+1.565
4.51%
1 jan 1981 ano
36.315
+0.021
0.06%
1 jan 1982 ano
36.165
-0.149
-0.41%
1 jan 1983 ano
35.168
-0.997
-2.76%
1 jan 1984 ano
34.617
-0.551
-1.57%
1 jan 1985 ano
34.313
-0.304
-0.88%
1 jan 1986 ano
33.193
-1.12
-3.26%
1 jan 1987 ano
32.491
-0.702
-2.12%
1 jan 1988 ano
33.293
+0.802
2.47%
1 jan 1989 ano
32.87
-0.423
-1.27%
1 jan 1990 ano
33.618
+0.748
2.28%
1 jan 1991 ano
34.066
+0.448
1.33%
1 jan 1992 ano
33.715
-0.352
-1.03%
1 jan 1993 ano
33.413
-0.302
-0.9%
1 jan 1994 ano
33.527
+0.114
0.34%
1 jan 1995 ano
33.473
-0.054
-0.16%
1 jan 1996 ano
33.724
+0.25
0.75%
1 jan 1997 ano
34.609
+0.885
2.62%
1 jan 1998 ano
34.401
-0.208
-0.6%
1 jan 1999 ano
33.244
-1.157
-3.36%
1 jan 2000 ano
33.458
+0.214
0.64%
1 jan 2001 ano
34.849
+1.392
4.16%
1 jan 2002 ano
33.752
-1.097
-3.15%
1 jan 2003 ano
34.828
+1.076
3.19%
1 jan 2004 ano
35.271
+0.443
1.27%
1 jan 2005 ano
36.389
+1.118
3.17%
1 jan 2006 ano
37.28
+0.892
2.45%
1 jan 2007 ano
37.562
+0.282
0.76%
1 jan 2008 ano
38.354
+0.792
2.11%
1 jan 2009 ano
38.73
+0.376
0.98%
1 jan 2010 ano
35.679
-3.051
-7.88%
1 jan 2011 ano
36.135
+0.455
1.28%
1 jan 2012 ano
37.224
+1.089
3.01%
1 jan 2013 ano
36.416
-0.808
-2.17%
1 jan 2014 ano
35.459
-0.957
-2.63%
1 jan 2015 ano
34.603
-0.856
-2.41%
1 jan 2016 ano
32.171
-2.431
-7.03%
Classificação de países por estatísticas atuais por anos


Comentários: