29
/pt/
pt
AIzaSyAYiBZKx7MnpbEhh9jyipgxe19OcubqV5w
April 1, 2024
146983
Guinea-Bissau
GNB
true
2
1
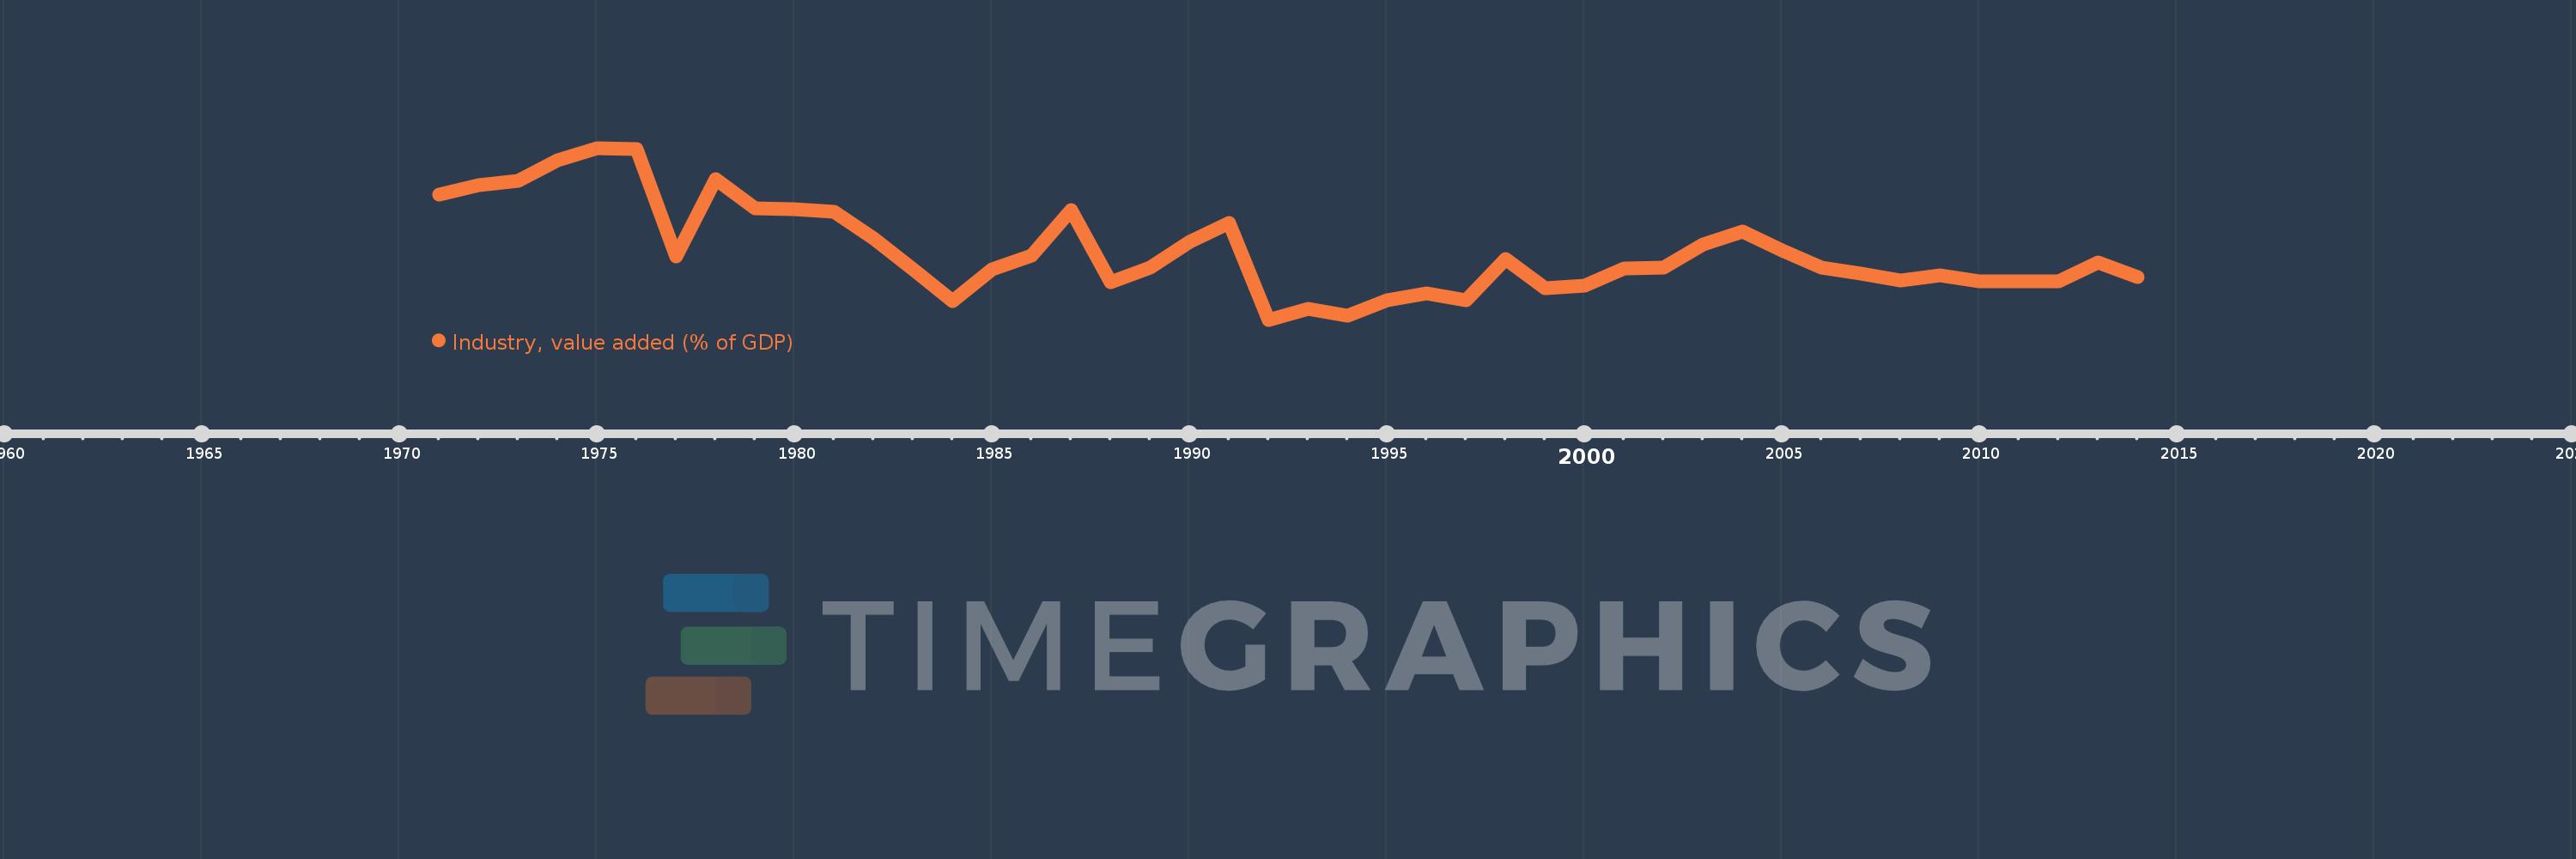
Industry, value added (% of GDP)
2014,2013,2012,2011,2010,2009,2008,2007,2006,2005,2004,2003,2002,2001,2000,1999,1998,1997,1996,1995,1994,1993,1992,1991,1990,1989,1988,1987,1986,1985,1984,1983,1982,1981,1980,1979,1978,1977,1976,1975,1974,1973,1972,1971
Estas estatísticas em outros países:
AfghanistanAlbaniaAlgeriaAndorraAngolaAntigua and BarbudaArab WorldArgentinaArmeniaArubaAustraliaAustriaAzerbaijanBahamas, TheBahrainBangladeshBarbadosBelarusBelgiumBelizeBeninBermudaBhutanBoliviaBosnia and HerzegovinaBotswanaBrazilBrunei DarussalamBulgariaBurkina FasoBurundiCabo VerdeCambodiaCameroonCanadaCaribbean small statesCayman IslandsCentral African RepublicCentral Europe and the BalticsChadChileChinaColombiaComorosCongo, Dem. Rep.Congo, Rep.Costa RicaCote d'IvoireCroatiaCubaCyprusCzech RepublicDenmarkDjiboutiDominicaDominican RepublicEarly-demographic dividendEast Asia & PacificEast Asia & Pacific (excluding high income)East Asia & Pacific (IDA & IBRD countries)EcuadorEgypt, Arab Rep.El SalvadorEquatorial GuineaEritreaEstoniaEthiopiaEuro areaEurope & Central AsiaEurope & Central Asia (excluding high income)Europe & Central Asia (IDA & IBRD countries)European UnionFijiFinlandFragile and conflict affected situationsFranceGabonGambia, TheGeorgiaGermanyGhanaGreeceGrenadaGuatemalaGuineaGuinea-BissauGuyanaHeavily indebted poor countries (HIPC)High incomeHondurasHong Kong SAR, ChinaHungaryIBRD onlyIcelandIDA & IBRD totalIDA blendIDA onlyIDA totalIndiaIndonesiaIran, Islamic Rep.IrelandItalyJamaicaJapanJordanKazakhstanKenyaKiribatiKorea, Rep.KosovoKuwaitKyrgyz RepublicLao PDRLate-demographic dividendLatin America & Caribbean Latin America & Caribbean (excluding high income)Latin America & the Caribbean (IDA & IBRD countries)LatviaLeast developed countries: UN classificationLebanonLesothoLibyaLiechtensteinLithuaniaLow & middle incomeLow incomeLower middle incomeLuxembourgMacao SAR, ChinaMacedonia, FYRMadagascarMalawiMalaysiaMaldivesMaliMaltaMarshall IslandsMauritaniaMauritiusMexicoMicronesia, Fed. Sts.Middle East & North AfricaMiddle East & North Africa (excluding high income)Middle East & North Africa (IDA & IBRD countries)Middle incomeMoldovaMongoliaMontenegroMoroccoMozambiqueMyanmarNamibiaNepalNetherlandsNew CaledoniaNew ZealandNicaraguaNigerNigeriaNorth AmericaNorwayOECD membersOmanOther small statesPacific island small statesPakistanPalauPanamaPapua New GuineaParaguayPeruPhilippinesPolandPortugalPost-demographic dividendPre-demographic dividendPuerto RicoQatarRomaniaRussian FederationRwandaSao Tome and PrincipeSaudi ArabiaSenegalSerbiaSeychellesSierra LeoneSingaporeSlovak RepublicSloveniaSmall statesSolomon IslandsSomaliaSouth AfricaSouth AsiaSouth Asia (IDA & IBRD)SpainSri LankaSt. Kitts and NevisSt. LuciaSt. Vincent and the GrenadinesSub-Saharan Africa Sub-Saharan Africa (excluding high income)Sub-Saharan Africa (IDA & IBRD countries)SudanSurinameSwazilandSwedenSwitzerlandSyrian Arab RepublicTajikistanTanzaniaThailandTimor-LesteTogoTongaTrinidad and TobagoTunisiaTurkeyTurkmenistanTuvaluUgandaUkraineUnited KingdomUnited StatesUpper middle incomeUruguayUzbekistanVanuatuVenezuela, RBVietnamWest Bank and GazaWorldYemen, Rep.ZambiaZimbabwe Linha do tempo:
Nesta escala de tempo está apresentado um gráfico de 1971 ano até 2014 ano Guinea-Bissau. Dados de 1970 ano ausente. O número de observações reais por data: 44.
Fonte (nome):
Indicadores de desenvolvimento mundial
Fonte (organização):
World Bank national accounts data, and OECD National Accounts data files.
Categorias:
Economy & Growth
Foi atualizado:
23 abr 2017 ano
Indicadores de alterações dos valores ao longo dos anos
Mínimo:
9.759
1 jan 1992 ano
Máximo:
25.492
1 jan 1975 ano
Na data de observação
Valor
Mudança absoluta
A alteração em relação ao valor anterior
1 jan 1971 ano
21.246
+21.246
0.0%
1 jan 1972 ano
22.078
+0.832
3.92%
1 jan 1973 ano
22.462
+0.384
1.74%
1 jan 1974 ano
24.394
+1.932
8.6%
1 jan 1975 ano
25.492
+1.098
4.5%
1 jan 1976 ano
25.362
-0.13
-0.51%
1 jan 1977 ano
15.527
-9.835
-38.78%
1 jan 1978 ano
22.639
+7.113
45.81%
1 jan 1979 ano
19.987
-2.652
-11.71%
1 jan 1980 ano
19.863
-0.125
-0.62%
1 jan 1981 ano
19.655
-0.207
-1.04%
1 jan 1982 ano
17.213
-2.442
-12.42%
1 jan 1983 ano
14.411
-2.803
-16.28%
1 jan 1984 ano
11.458
-2.952
-20.49%
1 jan 1985 ano
14.371
+2.913
25.42%
1 jan 1986 ano
15.641
+1.269
8.83%
1 jan 1987 ano
19.809
+4.168
26.65%
1 jan 1988 ano
13.227
-6.582
-33.23%
1 jan 1989 ano
14.501
+1.274
9.63%
1 jan 1990 ano
16.866
+2.365
16.31%
1 jan 1991 ano
18.601
+1.735
10.29%
1 jan 1992 ano
9.759
-8.842
-47.54%
1 jan 1993 ano
10.72
+0.961
9.85%
1 jan 1994 ano
10.108
-0.612
-5.71%
1 jan 1995 ano
11.559
+1.451
14.35%
1 jan 1996 ano
12.199
+0.64
5.53%
1 jan 1997 ano
11.58
-0.619
-5.07%
1 jan 1998 ano
15.296
+3.716
32.09%
1 jan 1999 ano
12.675
-2.621
-17.14%
1 jan 2000 ano
12.887
+0.212
1.67%
1 jan 2001 ano
14.451
+1.564
12.14%
1 jan 2002 ano
14.566
+0.115
0.8%
1 jan 2003 ano
16.69
+2.124
14.58%
1 jan 2004 ano
17.825
+1.135
6.8%
1 jan 2005 ano
16.075
-1.749
-9.81%
1 jan 2006 ano
14.498
-1.578
-9.82%
1 jan 2007 ano
13.971
-0.527
-3.63%
1 jan 2008 ano
13.335
-0.635
-4.55%
1 jan 2009 ano
13.797
+0.462
3.46%
1 jan 2010 ano
13.258
-0.539
-3.91%
1 jan 2011 ano
13.265
+0.007
0.05%
1 jan 2012 ano
13.244
-0.021
-0.16%
1 jan 2013 ano
14.981
+1.737
13.12%
1 jan 2014 ano
13.669
-1.312
-8.76%
Classificação de países por estatísticas atuais por anos


Comentários: