29
/pt/
pt
AIzaSyAYiBZKx7MnpbEhh9jyipgxe19OcubqV5w
April 1, 2024
205409
Namibia
NAM
true
2
1
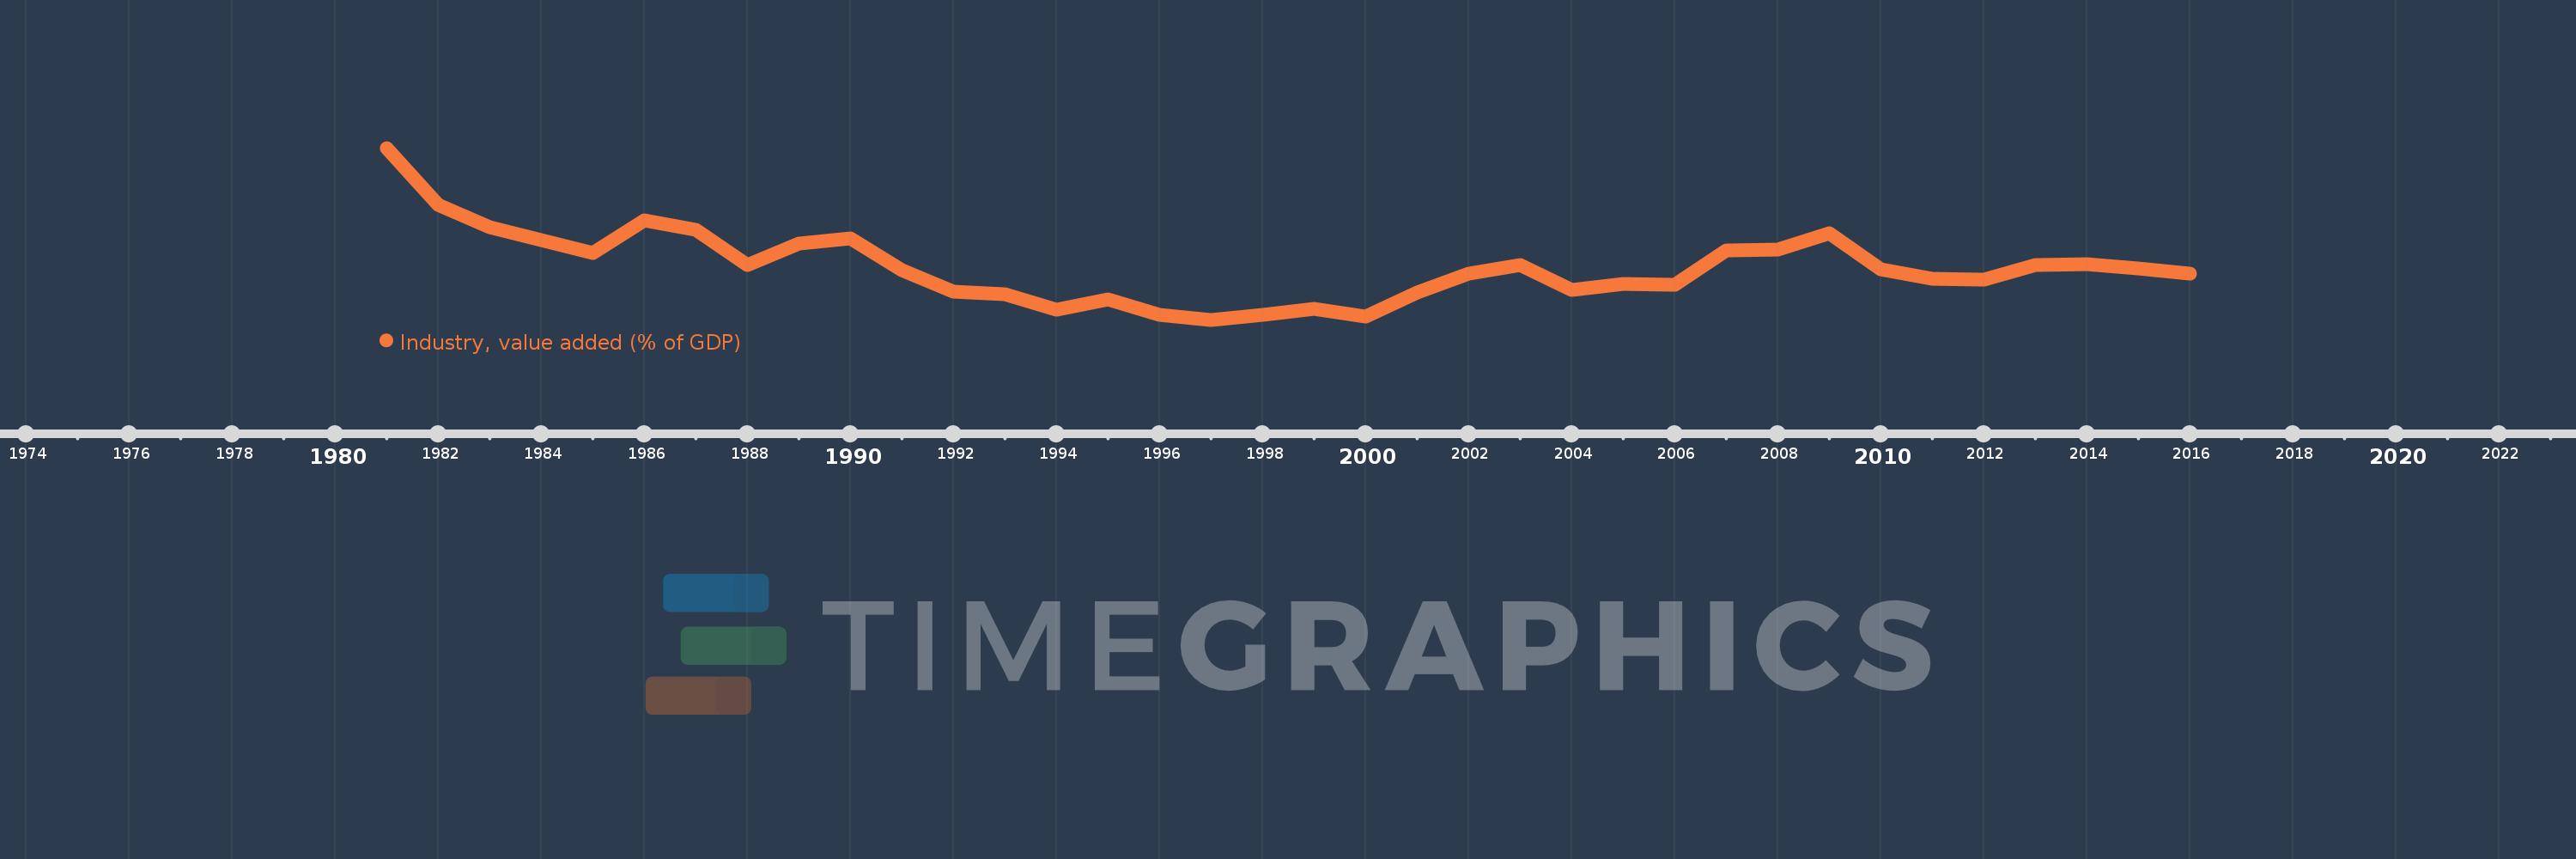
Industry, value added (% of GDP)
2016,2015,2014,2013,2012,2011,2010,2009,2008,2007,2006,2005,2004,2003,2002,2001,2000,1999,1998,1997,1996,1995,1994,1993,1992,1991,1990,1989,1988,1987,1986,1985,1984,1983,1982,1981
Estas estatísticas em outros países:
AfghanistanAlbaniaAlgeriaAndorraAngolaAntigua and BarbudaArab WorldArgentinaArmeniaArubaAustraliaAustriaAzerbaijanBahamas, TheBahrainBangladeshBarbadosBelarusBelgiumBelizeBeninBermudaBhutanBoliviaBosnia and HerzegovinaBotswanaBrazilBrunei DarussalamBulgariaBurkina FasoBurundiCabo VerdeCambodiaCameroonCanadaCaribbean small statesCayman IslandsCentral African RepublicCentral Europe and the BalticsChadChileChinaColombiaComorosCongo, Dem. Rep.Congo, Rep.Costa RicaCote d'IvoireCroatiaCubaCyprusCzech RepublicDenmarkDjiboutiDominicaDominican RepublicEarly-demographic dividendEast Asia & PacificEast Asia & Pacific (excluding high income)East Asia & Pacific (IDA & IBRD countries)EcuadorEgypt, Arab Rep.El SalvadorEquatorial GuineaEritreaEstoniaEthiopiaEuro areaEurope & Central AsiaEurope & Central Asia (excluding high income)Europe & Central Asia (IDA & IBRD countries)European UnionFijiFinlandFragile and conflict affected situationsFranceGabonGambia, TheGeorgiaGermanyGhanaGreeceGrenadaGuatemalaGuineaGuinea-BissauGuyanaHeavily indebted poor countries (HIPC)High incomeHondurasHong Kong SAR, ChinaHungaryIBRD onlyIcelandIDA & IBRD totalIDA blendIDA onlyIDA totalIndiaIndonesiaIran, Islamic Rep.IrelandItalyJamaicaJapanJordanKazakhstanKenyaKiribatiKorea, Rep.KosovoKuwaitKyrgyz RepublicLao PDRLate-demographic dividendLatin America & Caribbean Latin America & Caribbean (excluding high income)Latin America & the Caribbean (IDA & IBRD countries)LatviaLeast developed countries: UN classificationLebanonLesothoLibyaLiechtensteinLithuaniaLow & middle incomeLow incomeLower middle incomeLuxembourgMacao SAR, ChinaMacedonia, FYRMadagascarMalawiMalaysiaMaldivesMaliMaltaMarshall IslandsMauritaniaMauritiusMexicoMicronesia, Fed. Sts.Middle East & North AfricaMiddle East & North Africa (excluding high income)Middle East & North Africa (IDA & IBRD countries)Middle incomeMoldovaMongoliaMontenegroMoroccoMozambiqueMyanmarNamibiaNepalNetherlandsNew CaledoniaNew ZealandNicaraguaNigerNigeriaNorth AmericaNorwayOECD membersOmanOther small statesPacific island small statesPakistanPalauPanamaPapua New GuineaParaguayPeruPhilippinesPolandPortugalPost-demographic dividendPre-demographic dividendPuerto RicoQatarRomaniaRussian FederationRwandaSao Tome and PrincipeSaudi ArabiaSenegalSerbiaSeychellesSierra LeoneSingaporeSlovak RepublicSloveniaSmall statesSolomon IslandsSomaliaSouth AfricaSouth AsiaSouth Asia (IDA & IBRD)SpainSri LankaSt. Kitts and NevisSt. LuciaSt. Vincent and the GrenadinesSub-Saharan Africa Sub-Saharan Africa (excluding high income)Sub-Saharan Africa (IDA & IBRD countries)SudanSurinameSwazilandSwedenSwitzerlandSyrian Arab RepublicTajikistanTanzaniaThailandTimor-LesteTogoTongaTrinidad and TobagoTunisiaTurkeyTurkmenistanTuvaluUgandaUkraineUnited KingdomUnited StatesUpper middle incomeUruguayUzbekistanVanuatuVenezuela, RBVietnamWest Bank and GazaWorldYemen, Rep.ZambiaZimbabwe Linha do tempo:
Nesta escala de tempo está apresentado um gráfico de 1981 ano até 2016 ano Namibia. Dados de 1980 ano ausente. O número de observações reais por data: 36.
Fonte (nome):
Indicadores de desenvolvimento mundial
Fonte (organização):
World Bank national accounts data, and OECD National Accounts data files.
Categorias:
Economy & Growth
Foi atualizado:
23 abr 2017 ano
Indicadores de alterações dos valores ao longo dos anos
Mínimo:
23.675
1 jan 1997 ano
Máximo:
50.904
1 jan 1981 ano
Na data de observação
Valor
Mudança absoluta
A alteração em relação ao valor anterior
1 jan 1981 ano
50.904
+50.904
0.0%
1 jan 1982 ano
41.819
-9.085
-17.85%
1 jan 1983 ano
38.31
-3.508
-8.39%
1 jan 1984 ano
36.269
-2.042
-5.33%
1 jan 1985 ano
34.212
-2.057
-5.67%
1 jan 1986 ano
39.456
+5.244
15.33%
1 jan 1987 ano
37.952
-1.503
-3.81%
1 jan 1988 ano
32.364
-5.589
-14.73%
1 jan 1989 ano
35.708
+3.344
10.33%
1 jan 1990 ano
36.534
+0.826
2.31%
1 jan 1991 ano
31.521
-5.013
-13.72%
1 jan 1992 ano
28.102
-3.419
-10.85%
1 jan 1993 ano
27.662
-0.44
-1.57%
1 jan 1994 ano
25.283
-2.378
-8.6%
1 jan 1995 ano
26.934
+1.651
6.53%
1 jan 1996 ano
24.442
-2.493
-9.26%
1 jan 1997 ano
23.675
-0.767
-3.14%
1 jan 1998 ano
24.401
+0.726
3.07%
1 jan 1999 ano
25.4
+0.999
4.1%
1 jan 2000 ano
24.171
-1.229
-4.84%
1 jan 2001 ano
27.96
+3.788
15.67%
1 jan 2002 ano
30.918
+2.958
10.58%
1 jan 2003 ano
32.315
+1.397
4.52%
1 jan 2004 ano
28.346
-3.969
-12.28%
1 jan 2005 ano
29.417
+1.071
3.78%
1 jan 2006 ano
29.178
-0.239
-0.81%
1 jan 2007 ano
34.64
+5.462
18.72%
1 jan 2008 ano
34.766
+0.125
0.36%
1 jan 2009 ano
37.376
+2.61
7.51%
1 jan 2010 ano
31.611
-5.765
-15.42%
1 jan 2011 ano
30.184
-1.427
-4.51%
1 jan 2012 ano
30.081
-0.103
-0.34%
1 jan 2013 ano
32.386
+2.306
7.67%
1 jan 2014 ano
32.465
+0.078
0.24%
1 jan 2015 ano
31.8
-0.664
-2.05%
1 jan 2016 ano
30.97
-0.831
-2.61%
Classificação de países por estatísticas atuais por anos


Comentários: