29
/pt/
pt
AIzaSyAYiBZKx7MnpbEhh9jyipgxe19OcubqV5w
April 1, 2024
157430
Iran, Islamic Rep.
IRN
true
2
1
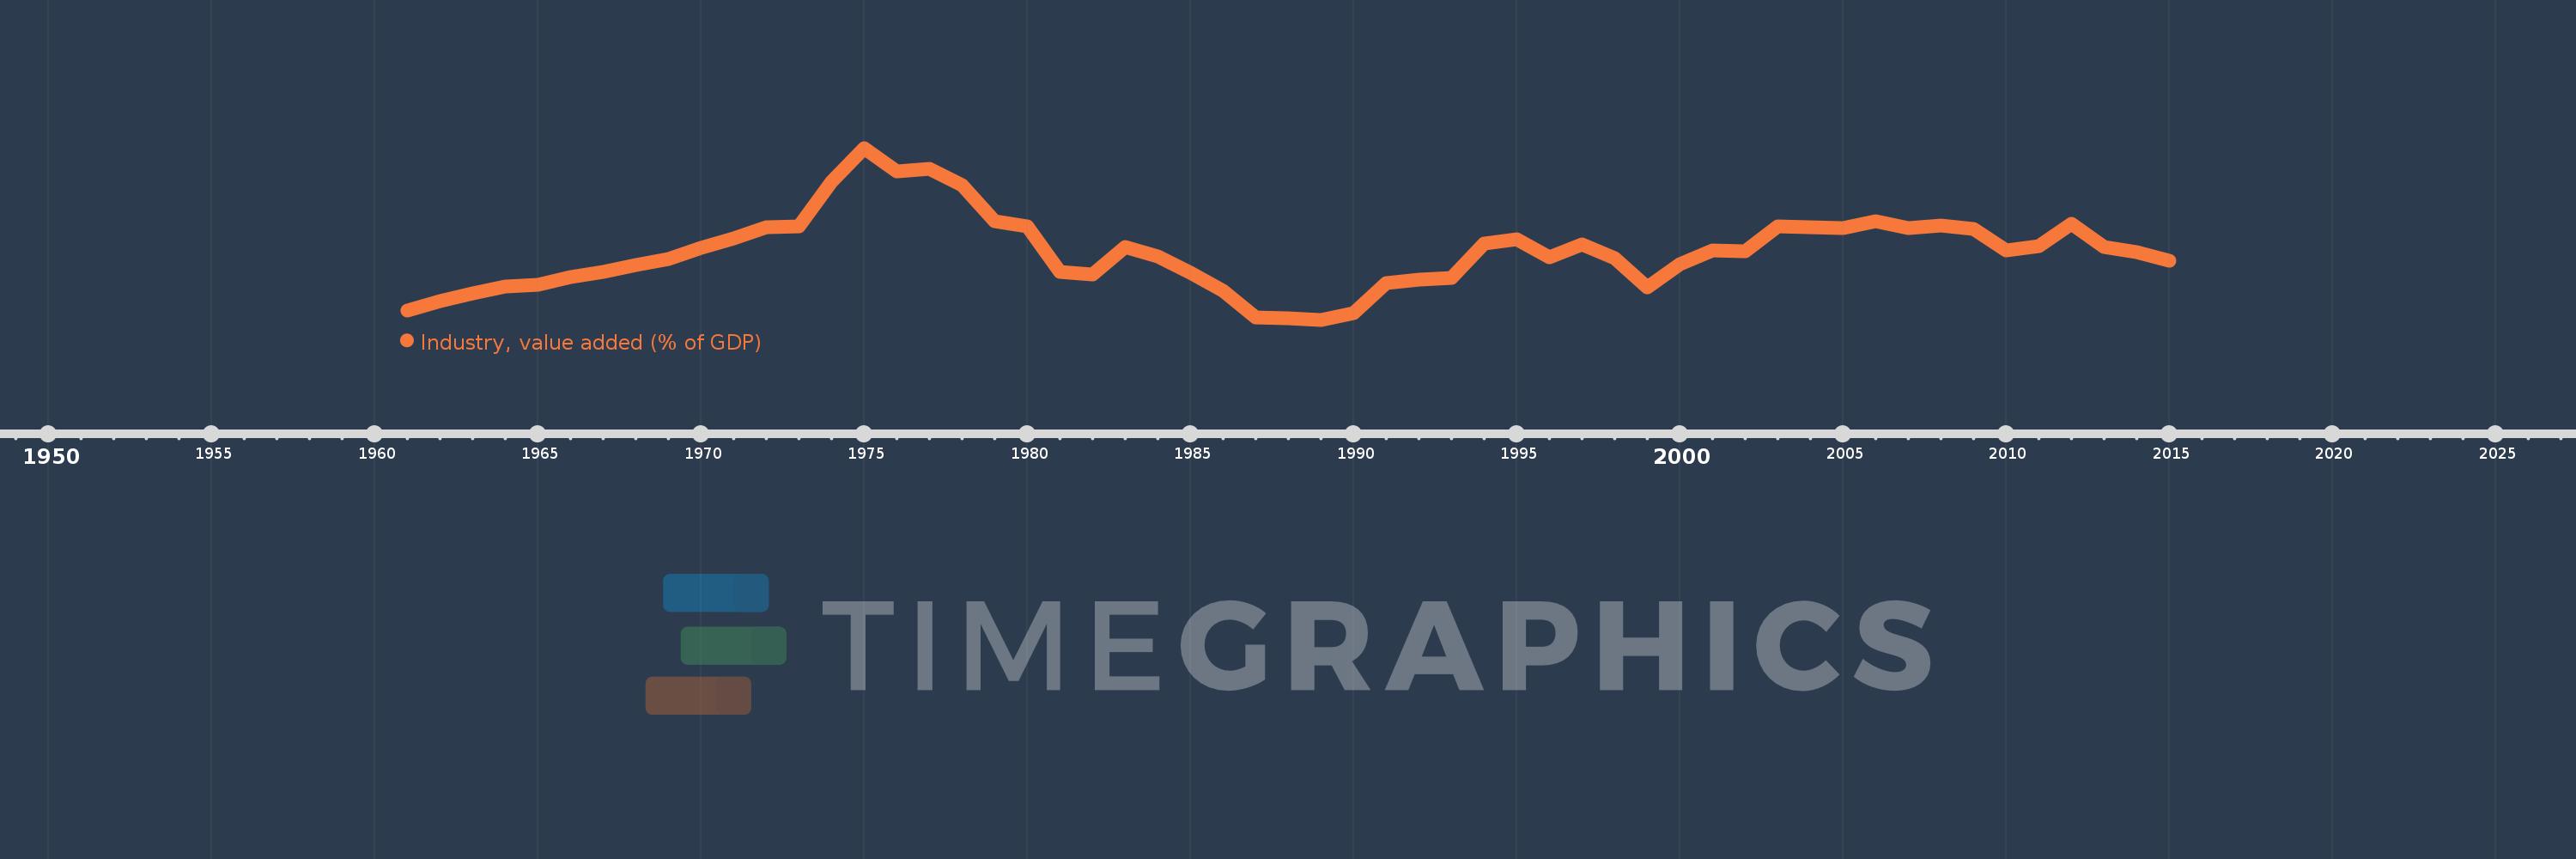
Industry, value added (% of GDP)
2015,2014,2013,2012,2011,2010,2009,2008,2007,2006,2005,2004,2003,2002,2001,2000,1999,1998,1997,1996,1995,1994,1993,1992,1991,1990,1989,1988,1987,1986,1985,1984,1983,1982,1981,1980,1979,1978,1977,1976,1975,1974,1973,1972,1971,1970,1969,1968,1967,1966,1965,1964,1963,1962,1961
Estas estatísticas em outros países:
AfghanistanAlbaniaAlgeriaAndorraAngolaAntigua and BarbudaArab WorldArgentinaArmeniaArubaAustraliaAustriaAzerbaijanBahamas, TheBahrainBangladeshBarbadosBelarusBelgiumBelizeBeninBermudaBhutanBoliviaBosnia and HerzegovinaBotswanaBrazilBrunei DarussalamBulgariaBurkina FasoBurundiCabo VerdeCambodiaCameroonCanadaCaribbean small statesCayman IslandsCentral African RepublicCentral Europe and the BalticsChadChileChinaColombiaComorosCongo, Dem. Rep.Congo, Rep.Costa RicaCote d'IvoireCroatiaCubaCyprusCzech RepublicDenmarkDjiboutiDominicaDominican RepublicEarly-demographic dividendEast Asia & PacificEast Asia & Pacific (excluding high income)East Asia & Pacific (IDA & IBRD countries)EcuadorEgypt, Arab Rep.El SalvadorEquatorial GuineaEritreaEstoniaEthiopiaEuro areaEurope & Central AsiaEurope & Central Asia (excluding high income)Europe & Central Asia (IDA & IBRD countries)European UnionFijiFinlandFragile and conflict affected situationsFranceGabonGambia, TheGeorgiaGermanyGhanaGreeceGrenadaGuatemalaGuineaGuinea-BissauGuyanaHeavily indebted poor countries (HIPC)High incomeHondurasHong Kong SAR, ChinaHungaryIBRD onlyIcelandIDA & IBRD totalIDA blendIDA onlyIDA totalIndiaIndonesiaIran, Islamic Rep.IrelandItalyJamaicaJapanJordanKazakhstanKenyaKiribatiKorea, Rep.KosovoKuwaitKyrgyz RepublicLao PDRLate-demographic dividendLatin America & Caribbean Latin America & Caribbean (excluding high income)Latin America & the Caribbean (IDA & IBRD countries)LatviaLeast developed countries: UN classificationLebanonLesothoLibyaLiechtensteinLithuaniaLow & middle incomeLow incomeLower middle incomeLuxembourgMacao SAR, ChinaMacedonia, FYRMadagascarMalawiMalaysiaMaldivesMaliMaltaMarshall IslandsMauritaniaMauritiusMexicoMicronesia, Fed. Sts.Middle East & North AfricaMiddle East & North Africa (excluding high income)Middle East & North Africa (IDA & IBRD countries)Middle incomeMoldovaMongoliaMontenegroMoroccoMozambiqueMyanmarNamibiaNepalNetherlandsNew CaledoniaNew ZealandNicaraguaNigerNigeriaNorth AmericaNorwayOECD membersOmanOther small statesPacific island small statesPakistanPalauPanamaPapua New GuineaParaguayPeruPhilippinesPolandPortugalPost-demographic dividendPre-demographic dividendPuerto RicoQatarRomaniaRussian FederationRwandaSao Tome and PrincipeSaudi ArabiaSenegalSerbiaSeychellesSierra LeoneSingaporeSlovak RepublicSloveniaSmall statesSolomon IslandsSomaliaSouth AfricaSouth AsiaSouth Asia (IDA & IBRD)SpainSri LankaSt. Kitts and NevisSt. LuciaSt. Vincent and the GrenadinesSub-Saharan Africa Sub-Saharan Africa (excluding high income)Sub-Saharan Africa (IDA & IBRD countries)SudanSurinameSwazilandSwedenSwitzerlandSyrian Arab RepublicTajikistanTanzaniaThailandTimor-LesteTogoTongaTrinidad and TobagoTunisiaTurkeyTurkmenistanTuvaluUgandaUkraineUnited KingdomUnited StatesUpper middle incomeUruguayUzbekistanVanuatuVenezuela, RBVietnamWest Bank and GazaWorldYemen, Rep.ZambiaZimbabwe Linha do tempo:
Nesta escala de tempo está apresentado um gráfico de 1961 ano até 2015 ano Iran, Islamic Rep.. Dados de 1960 ano ausente. O número de observações reais por data: 55.
Fonte (nome):
Indicadores de desenvolvimento mundial
Fonte (organização):
World Bank national accounts data, and OECD National Accounts data files.
Categorias:
Economy & Growth
Foi atualizado:
23 abr 2017 ano
Indicadores de alterações dos valores ao longo dos anos
Mínimo:
25.385
1 jan 1989 ano
Máximo:
63.044
1 jan 1975 ano
Na data de observação
Valor
Mudança absoluta
A alteração em relação ao valor anterior
1 jan 1961 ano
27.312
+27.312
0.0%
1 jan 1962 ano
29.385
+2.073
7.59%
1 jan 1963 ano
31.149
+1.764
6.0%
1 jan 1964 ano
32.646
+1.497
4.81%
1 jan 1965 ano
33.087
+0.441
1.35%
1 jan 1966 ano
34.682
+1.595
4.82%
1 jan 1967 ano
35.783
+1.101
3.17%
1 jan 1968 ano
37.438
+1.656
4.63%
1 jan 1969 ano
38.703
+1.265
3.38%
1 jan 1970 ano
41.124
+2.421
6.26%
1 jan 1971 ano
43.261
+2.136
5.19%
1 jan 1972 ano
45.729
+2.468
5.7%
1 jan 1973 ano
45.837
+0.109
0.24%
1 jan 1974 ano
55.733
+9.896
21.59%
1 jan 1975 ano
63.044
+7.31
13.12%
1 jan 1976 ano
57.845
-5.199
-8.25%
1 jan 1977 ano
58.425
+0.58
1.0%
1 jan 1978 ano
54.927
-3.499
-5.99%
1 jan 1979 ano
47.052
-7.875
-14.34%
1 jan 1980 ano
45.785
-1.267
-2.69%
1 jan 1981 ano
35.931
-9.853
-21.52%
1 jan 1982 ano
35.217
-0.714
-1.99%
1 jan 1983 ano
41.257
+6.04
17.15%
1 jan 1984 ano
39.222
-2.035
-4.93%
1 jan 1985 ano
35.656
-3.566
-9.09%
1 jan 1986 ano
31.658
-3.998
-11.21%
1 jan 1987 ano
25.805
-5.853
-18.49%
1 jan 1988 ano
25.779
-0.026
-0.1%
1 jan 1989 ano
25.385
-0.393
-1.53%
1 jan 1990 ano
26.82
+1.435
5.65%
1 jan 1991 ano
33.514
+6.694
24.96%
1 jan 1992 ano
34.249
+0.736
2.2%
1 jan 1993 ano
34.479
+0.229
0.67%
1 jan 1994 ano
41.999
+7.52
21.81%
1 jan 1995 ano
42.999
+1.0
2.38%
1 jan 1996 ano
38.995
-4.004
-9.31%
1 jan 1997 ano
41.986
+2.991
7.67%
1 jan 1998 ano
38.823
-3.163
-7.53%
1 jan 1999 ano
32.56
-6.263
-16.13%
1 jan 2000 ano
37.636
+5.076
15.59%
1 jan 2001 ano
40.563
+2.927
7.78%
1 jan 2002 ano
40.306
-0.257
-0.63%
1 jan 2003 ano
45.927
+5.621
13.95%
1 jan 2004 ano
45.573
-0.354
-0.77%
1 jan 2005 ano
45.403
-0.17
-0.37%
1 jan 2006 ano
46.908
+1.506
3.32%
1 jan 2007 ano
45.443
-1.466
-3.12%
1 jan 2008 ano
45.99
+0.547
1.2%
1 jan 2009 ano
45.214
-0.775
-1.69%
1 jan 2010 ano
40.552
-4.662
-10.31%
1 jan 2011 ano
41.432
+0.88
2.17%
1 jan 2012 ano
46.473
+5.041
12.17%
1 jan 2013 ano
41.36
-5.113
-11.0%
1 jan 2014 ano
40.187
-1.172
-2.83%
1 jan 2015 ano
38.229
-1.959
-4.87%
Classificação de países por estatísticas atuais por anos


Comentários: