29
/pt/
pt
AIzaSyAYiBZKx7MnpbEhh9jyipgxe19OcubqV5w
April 1, 2024
255730
Swaziland
SWZ
true
2
1
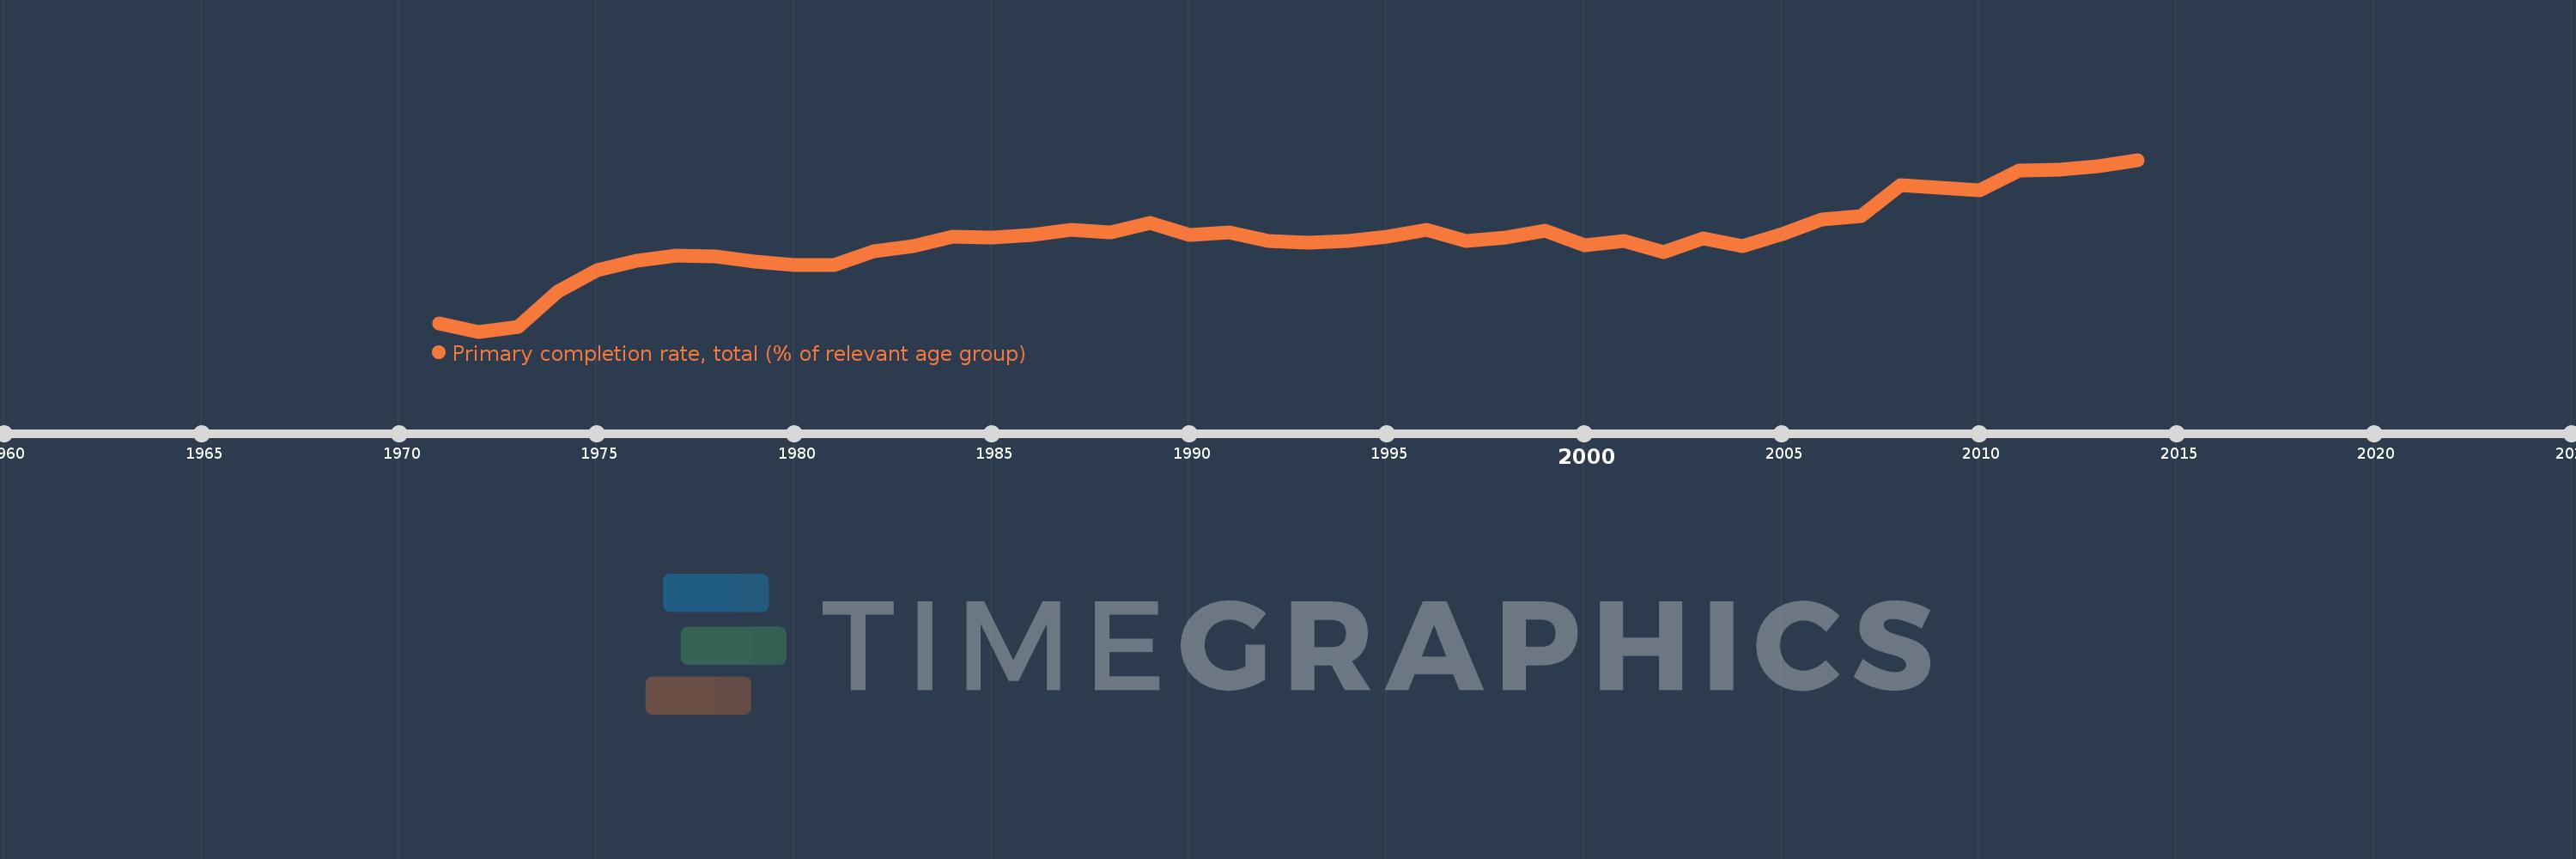
Primary completion rate, total (% of relevant age group)
2014,2013,2012,2011,2010,2008,2007,2006,2005,2004,2003,2002,2001,2000,1999,1998,1997,1996,1995,1994,1993,1992,1991,1990,1989,1988,1987,1986,1985,1984,1983,1982,1981,1980,1979,1978,1977,1976,1975,1974,1973,1972,1971
Estas estatísticas em outros países:
AfghanistanAlbaniaAlgeriaAngolaAntigua and BarbudaArab WorldArgentinaArmeniaArubaAustriaAzerbaijanBahamas, TheBahrainBangladeshBarbadosBelarusBelgiumBelizeBeninBermudaBhutanBoliviaBosnia and HerzegovinaBotswanaBrazilBritish Virgin IslandsBrunei DarussalamBulgariaBurkina FasoBurundiCabo VerdeCambodiaCameroonCanadaCaribbean small statesCentral African RepublicCentral Europe and the BalticsChadChileChinaColombiaComorosCongo, Dem. Rep.Congo, Rep.Costa RicaCote d'IvoireCroatiaCubaCyprusCzech RepublicDenmarkDjiboutiDominicaDominican RepublicEarly-demographic dividendEast Asia & PacificEast Asia & Pacific (excluding high income)East Asia & Pacific (IDA & IBRD countries)EcuadorEgypt, Arab Rep.El SalvadorEquatorial GuineaEritreaEstoniaEthiopiaEuro areaEurope & Central AsiaEurope & Central Asia (excluding high income)Europe & Central Asia (IDA & IBRD countries)European UnionFijiFinlandFragile and conflict affected situationsFranceGabonGambia, TheGeorgiaGermanyGhanaGreeceGrenadaGuatemalaGuineaGuinea-BissauGuyanaHaitiHeavily indebted poor countries (HIPC)High incomeHondurasHong Kong SAR, ChinaHungaryIBRD onlyIcelandIDA & IBRD totalIDA blendIDA onlyIDA totalIndiaIndonesiaIran, Islamic Rep.IraqIrelandIsraelItalyJamaicaJapanJordanKazakhstanKenyaKiribatiKorea, Dem. People’s Rep.Korea, Rep.KuwaitKyrgyz RepublicLao PDRLate-demographic dividendLatin America & Caribbean Latin America & Caribbean (excluding high income)Latin America & the Caribbean (IDA & IBRD countries)LatviaLeast developed countries: UN classificationLebanonLesothoLiberiaLibyaLiechtensteinLithuaniaLow & middle incomeLow incomeLower middle incomeLuxembourgMacao SAR, ChinaMacedonia, FYRMadagascarMalawiMalaysiaMaldivesMaliMaltaMarshall IslandsMauritaniaMauritiusMexicoMiddle East & North AfricaMiddle East & North Africa (excluding high income)Middle East & North Africa (IDA & IBRD countries)Middle incomeMoldovaMongoliaMontenegroMoroccoMozambiqueMyanmarNamibiaNauruNepalNetherlandsNew ZealandNicaraguaNigerNigeriaNorwayOECD membersOmanOther small statesPacific island small statesPakistanPalauPanamaPapua New GuineaParaguayPeruPhilippinesPolandPortugalPost-demographic dividendPre-demographic dividendQatarRomaniaRussian FederationRwandaSamoaSan MarinoSao Tome and PrincipeSaudi ArabiaSenegalSerbiaSeychellesSierra LeoneSlovak RepublicSloveniaSmall statesSolomon IslandsSouth AfricaSouth AsiaSouth Asia (IDA & IBRD)South SudanSpainSri LankaSt. Kitts and NevisSt. LuciaSt. Vincent and the GrenadinesSub-Saharan Africa Sub-Saharan Africa (excluding high income)Sub-Saharan Africa (IDA & IBRD countries)SudanSurinameSwazilandSwedenSwitzerlandSyrian Arab RepublicTajikistanTanzaniaThailandTimor-LesteTogoTongaTrinidad and TobagoTunisiaTurkeyTuvaluUgandaUkraineUnited Arab EmiratesUpper middle incomeUruguayUzbekistanVanuatuVenezuela, RBVietnamWest Bank and GazaWorldYemen, Rep.ZambiaZimbabwe Linha do tempo:
Nesta escala de tempo está apresentado um gráfico de 1971 ano até 2014 ano Swaziland. Dados de 1970 ano ausente. O número de observações reais por data: 43.
Fonte (nome):
Indicadores de desenvolvimento mundial
Fonte (organização):
United Nations Educational, Scientific, and Cultural Organization (UNESCO) Institute for Statistics.
Categorias:
Aid Effectiveness, Climate Change, Education
Foi atualizado:
23 abr 2017 ano
Indicadores de alterações dos valores ao longo dos anos
Mínimo:
40.598
1 jan 1972 ano
Máximo:
79.008
1 jan 2014 ano
Na data de observação
Valor
Mudança absoluta
A alteração em relação ao valor anterior
1 jan 1971 ano
42.338
+42.338
0.0%
1 jan 1972 ano
40.598
-1.74
-4.11%
1 jan 1973 ano
41.593
+0.995
2.45%
1 jan 1974 ano
49.585
+7.992
19.21%
1 jan 1975 ano
54.367
+4.782
9.64%
1 jan 1976 ano
56.529
+2.161
3.98%
1 jan 1977 ano
57.619
+1.09
1.93%
1 jan 1978 ano
57.322
-0.297
-0.52%
1 jan 1979 ano
56.162
-1.16
-2.02%
1 jan 1980 ano
55.405
-0.758
-1.35%
1 jan 1981 ano
55.533
+0.128
0.23%
1 jan 1982 ano
58.557
+3.024
5.44%
1 jan 1983 ano
59.8
+1.243
2.12%
1 jan 1984 ano
61.83
+2.03
3.4%
1 jan 1985 ano
61.655
-0.176
-0.28%
1 jan 1986 ano
62.196
+0.542
0.88%
1 jan 1987 ano
63.425
+1.228
1.98%
1 jan 1988 ano
62.685
-0.739
-1.17%
1 jan 1989 ano
64.9
+2.215
3.53%
1 jan 1990 ano
62.12
-2.78
-4.28%
1 jan 1991 ano
62.818
+0.698
1.12%
1 jan 1992 ano
60.782
-2.036
-3.24%
1 jan 1993 ano
60.535
-0.248
-0.41%
1 jan 1994 ano
60.767
+0.233
0.38%
1 jan 1995 ano
61.819
+1.051
1.73%
1 jan 1996 ano
63.382
+1.564
2.53%
1 jan 1997 ano
60.909
-2.474
-3.9%
1 jan 1998 ano
61.591
+0.683
1.12%
1 jan 1999 ano
63.09
+1.499
2.43%
1 jan 2000 ano
59.908
-3.182
-5.04%
1 jan 2001 ano
60.861
+0.953
1.59%
1 jan 2002 ano
58.389
-2.473
-4.06%
1 jan 2003 ano
61.496
+3.107
5.32%
1 jan 2004 ano
59.687
-1.808
-2.94%
1 jan 2005 ano
62.417
+2.73
4.57%
1 jan 2006 ano
65.581
+3.164
5.07%
1 jan 2007 ano
66.335
+0.754
1.15%
1 jan 2008 ano
73.302
+6.967
10.5%
1 jan 2010 ano
72.185
-1.117
-1.52%
1 jan 2011 ano
76.677
+4.492
6.22%
1 jan 2012 ano
76.832
+0.155
0.2%
1 jan 2013 ano
77.499
+0.667
0.87%
1 jan 2014 ano
79.008
+1.509
1.95%
Classificação de países por estatísticas atuais por anos


Comentários: