29
/pt/
pt
AIzaSyAYiBZKx7MnpbEhh9jyipgxe19OcubqV5w
April 1, 2024
231647
Rwanda
RWA
true
2
1
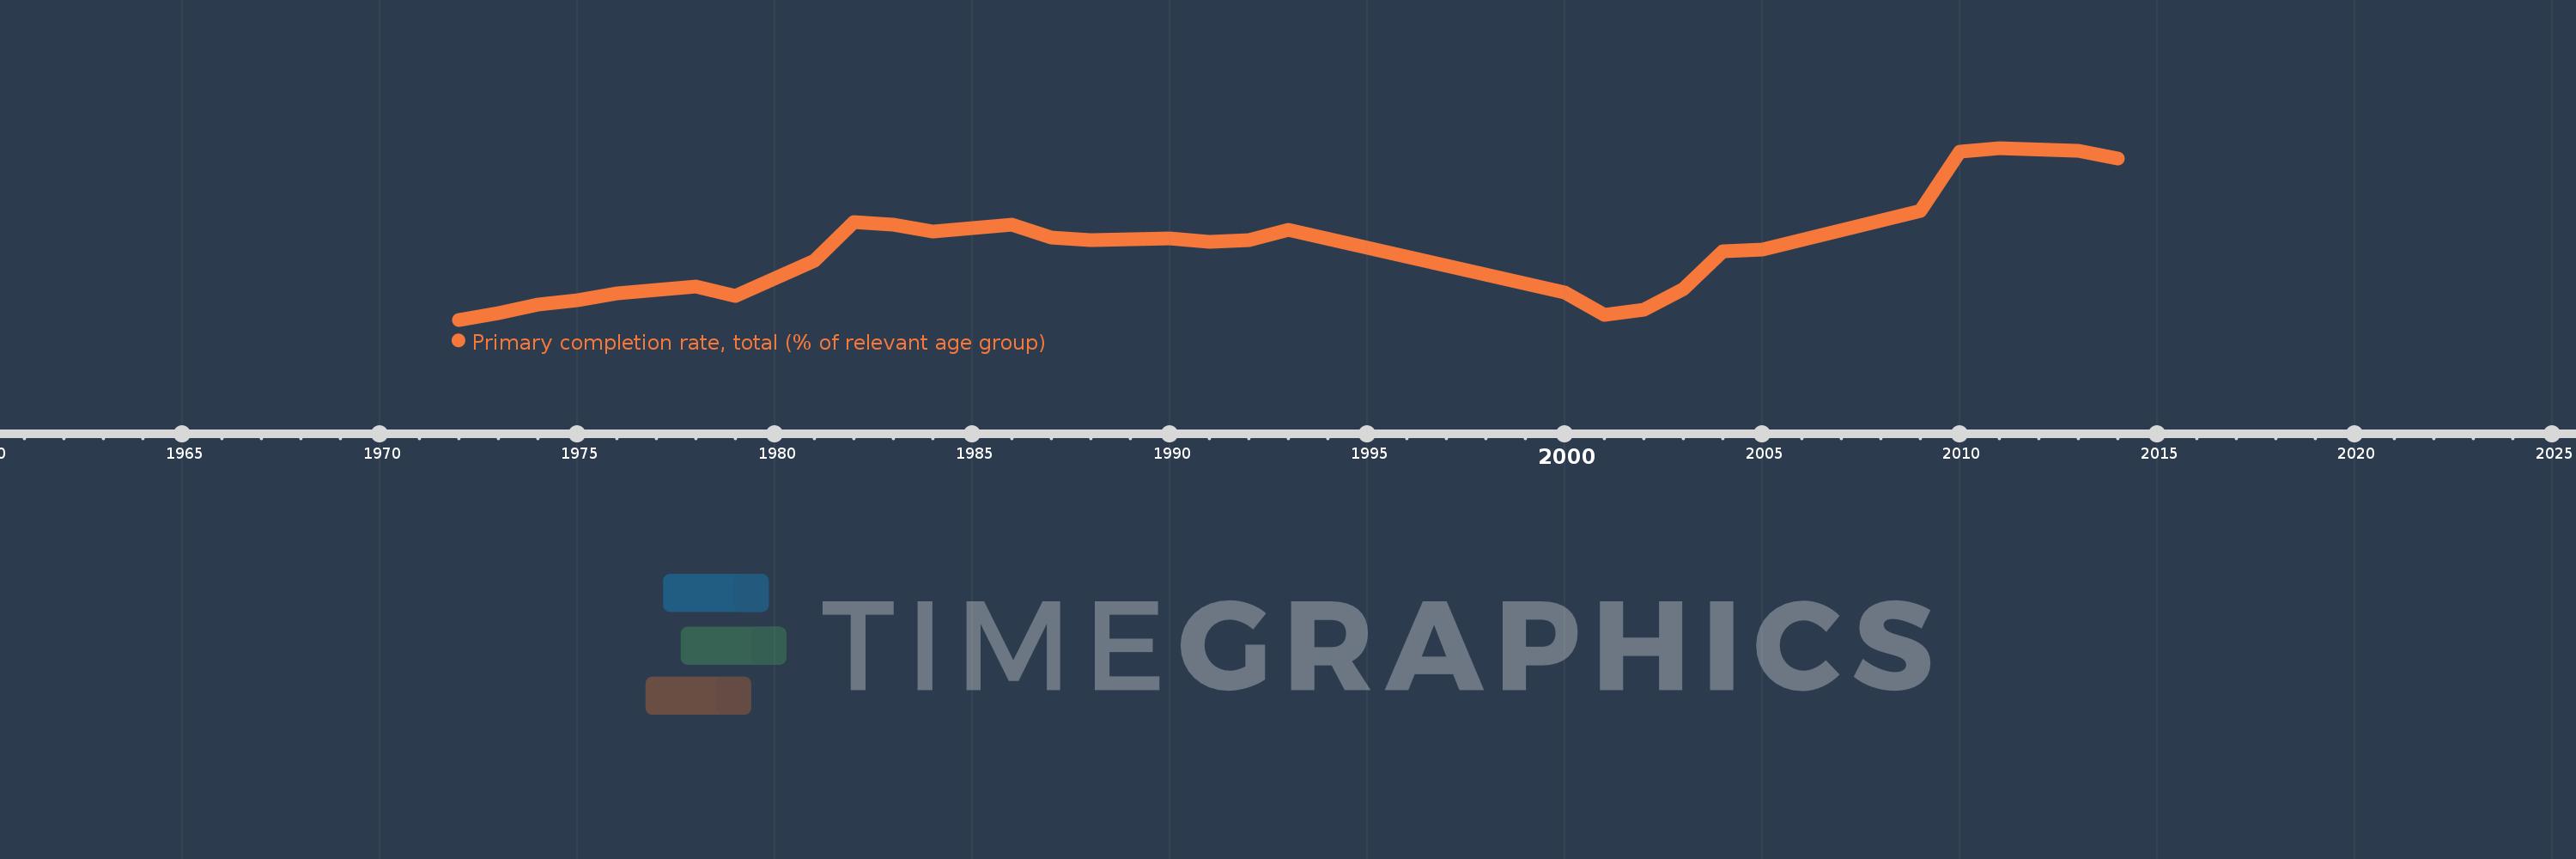
Primary completion rate, total (% of relevant age group)
2014,2013,2011,2010,2009,2005,2004,2003,2002,2001,2000,1993,1992,1991,1990,1989,1988,1987,1986,1985,1984,1983,1982,1981,1979,1978,1976,1975,1974,1973,1972
Estas estatísticas em outros países:
AfghanistanAlbaniaAlgeriaAngolaAntigua and BarbudaArab WorldArgentinaArmeniaArubaAustriaAzerbaijanBahamas, TheBahrainBangladeshBarbadosBelarusBelgiumBelizeBeninBermudaBhutanBoliviaBosnia and HerzegovinaBotswanaBrazilBritish Virgin IslandsBrunei DarussalamBulgariaBurkina FasoBurundiCabo VerdeCambodiaCameroonCanadaCaribbean small statesCentral African RepublicCentral Europe and the BalticsChadChileChinaColombiaComorosCongo, Dem. Rep.Congo, Rep.Costa RicaCote d'IvoireCroatiaCubaCyprusCzech RepublicDenmarkDjiboutiDominicaDominican RepublicEarly-demographic dividendEast Asia & PacificEast Asia & Pacific (excluding high income)East Asia & Pacific (IDA & IBRD countries)EcuadorEgypt, Arab Rep.El SalvadorEquatorial GuineaEritreaEstoniaEthiopiaEuro areaEurope & Central AsiaEurope & Central Asia (excluding high income)Europe & Central Asia (IDA & IBRD countries)European UnionFijiFinlandFragile and conflict affected situationsFranceGabonGambia, TheGeorgiaGermanyGhanaGreeceGrenadaGuatemalaGuineaGuinea-BissauGuyanaHaitiHeavily indebted poor countries (HIPC)High incomeHondurasHong Kong SAR, ChinaHungaryIBRD onlyIcelandIDA & IBRD totalIDA blendIDA onlyIDA totalIndiaIndonesiaIran, Islamic Rep.IraqIrelandIsraelItalyJamaicaJapanJordanKazakhstanKenyaKiribatiKorea, Dem. People’s Rep.Korea, Rep.KuwaitKyrgyz RepublicLao PDRLate-demographic dividendLatin America & Caribbean Latin America & Caribbean (excluding high income)Latin America & the Caribbean (IDA & IBRD countries)LatviaLeast developed countries: UN classificationLebanonLesothoLiberiaLibyaLiechtensteinLithuaniaLow & middle incomeLow incomeLower middle incomeLuxembourgMacao SAR, ChinaMacedonia, FYRMadagascarMalawiMalaysiaMaldivesMaliMaltaMarshall IslandsMauritaniaMauritiusMexicoMiddle East & North AfricaMiddle East & North Africa (excluding high income)Middle East & North Africa (IDA & IBRD countries)Middle incomeMoldovaMongoliaMontenegroMoroccoMozambiqueMyanmarNamibiaNauruNepalNetherlandsNew ZealandNicaraguaNigerNigeriaNorwayOECD membersOmanOther small statesPacific island small statesPakistanPalauPanamaPapua New GuineaParaguayPeruPhilippinesPolandPortugalPost-demographic dividendPre-demographic dividendQatarRomaniaRussian FederationRwandaSamoaSan MarinoSao Tome and PrincipeSaudi ArabiaSenegalSerbiaSeychellesSierra LeoneSlovak RepublicSloveniaSmall statesSolomon IslandsSouth AfricaSouth AsiaSouth Asia (IDA & IBRD)South SudanSpainSri LankaSt. Kitts and NevisSt. LuciaSt. Vincent and the GrenadinesSub-Saharan Africa Sub-Saharan Africa (excluding high income)Sub-Saharan Africa (IDA & IBRD countries)SudanSurinameSwazilandSwedenSwitzerlandSyrian Arab RepublicTajikistanTanzaniaThailandTimor-LesteTogoTongaTrinidad and TobagoTunisiaTurkeyTuvaluUgandaUkraineUnited Arab EmiratesUpper middle incomeUruguayUzbekistanVanuatuVenezuela, RBVietnamWest Bank and GazaWorldYemen, Rep.ZambiaZimbabwe Linha do tempo:
Nesta escala de tempo está apresentado um gráfico de 1972 ano até 2014 ano Rwanda. Dados de 1971 ano ausente. O número de observações reais por data: 31.
Fonte (nome):
Indicadores de desenvolvimento mundial
Fonte (organização):
United Nations Educational, Scientific, and Cultural Organization (UNESCO) Institute for Statistics.
Categorias:
Aid Effectiveness, Climate Change, Education
Foi atualizado:
23 abr 2017 ano
Indicadores de alterações dos valores ao longo dos anos
Mínimo:
21.143
1 jan 1972 ano
Máximo:
69.547
1 jan 2011 ano
Na data de observação
Valor
Mudança absoluta
A alteração em relação ao valor anterior
1 jan 1972 ano
21.143
+21.143
0.0%
1 jan 1973 ano
22.969
+1.826
8.64%
1 jan 1974 ano
25.499
+2.53
11.01%
1 jan 1975 ano
26.711
+1.212
4.75%
1 jan 1976 ano
28.454
+1.743
6.52%
1 jan 1978 ano
30.425
+1.971
6.93%
1 jan 1979 ano
27.952
-2.473
-8.13%
1 jan 1981 ano
37.676
+9.724
34.79%
1 jan 1982 ano
48.674
+10.997
29.19%
1 jan 1983 ano
47.824
-0.85
-1.75%
1 jan 1984 ano
46.072
-1.752
-3.66%
1 jan 1985 ano
47.027
+0.955
2.07%
1 jan 1986 ano
48.02
+0.993
2.11%
1 jan 1987 ano
44.309
-3.712
-7.73%
1 jan 1988 ano
43.498
-0.811
-1.83%
1 jan 1989 ano
43.932
+0.435
1.0%
1 jan 1990 ano
44.086
+0.153
0.35%
1 jan 1991 ano
43.131
-0.955
-2.17%
1 jan 1992 ano
43.5
+0.368
0.85%
1 jan 1993 ano
46.599
+3.1
7.13%
1 jan 2000 ano
28.869
-17.73
-38.05%
1 jan 2001 ano
22.556
-6.313
-21.87%
1 jan 2002 ano
23.886
+1.33
5.9%
1 jan 2003 ano
29.848
+5.962
24.96%
1 jan 2004 ano
40.455
+10.607
35.54%
1 jan 2005 ano
40.925
+0.47
1.16%
1 jan 2009 ano
51.79
+10.865
26.55%
1 jan 2010 ano
68.428
+16.638
32.13%
1 jan 2011 ano
69.547
+1.12
1.64%
1 jan 2013 ano
68.634
-0.913
-1.31%
1 jan 2014 ano
66.565
-2.07
-3.02%
Classificação de países por estatísticas atuais por anos


Comentários: