29
/pt/
pt
AIzaSyAYiBZKx7MnpbEhh9jyipgxe19OcubqV5w
April 1, 2024
156631
Indonesia
IDN
true
2
1
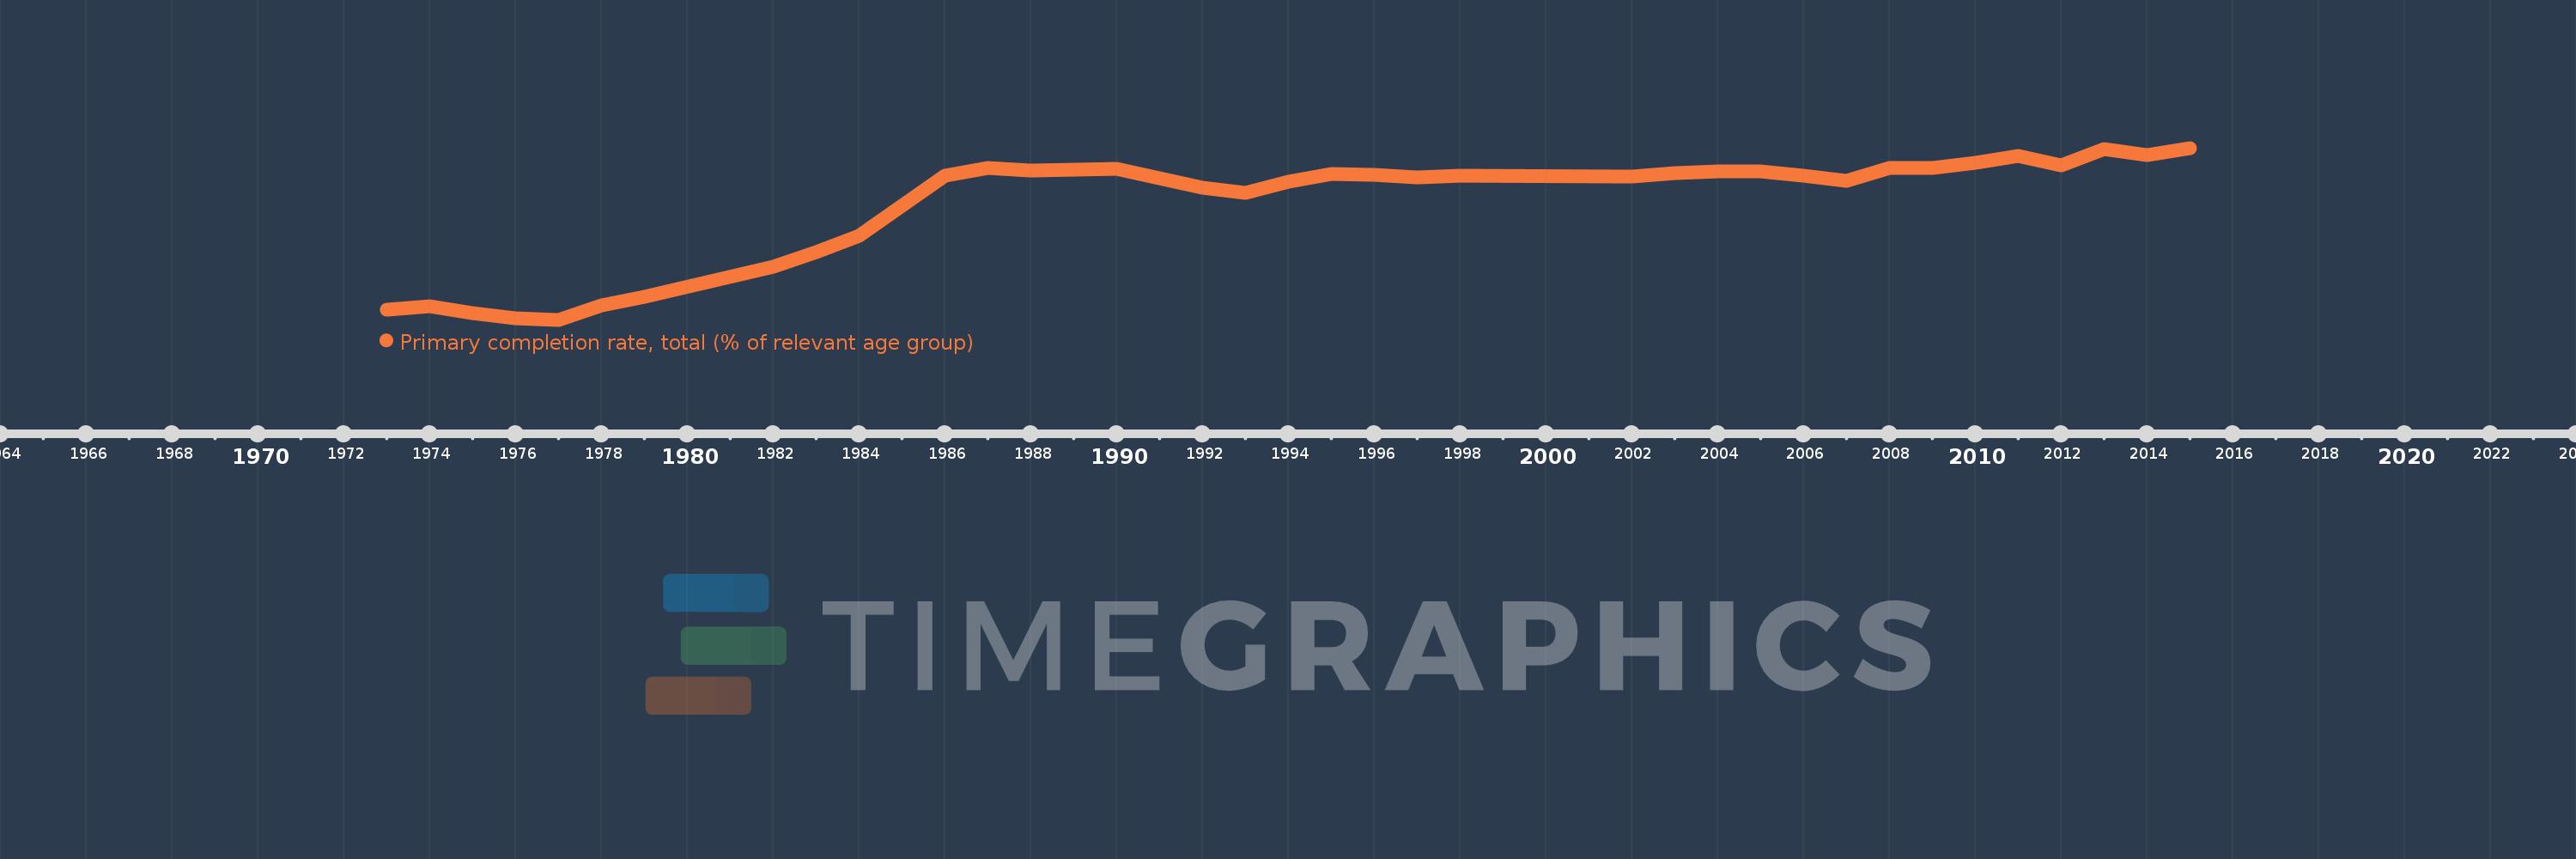
Primary completion rate, total (% of relevant age group)
2015,2014,2013,2012,2011,2010,2009,2008,2007,2006,2005,2004,2003,2002,1998,1997,1996,1995,1994,1993,1992,1991,1990,1989,1988,1987,1986,1985,1984,1983,1982,1979,1978,1977,1976,1975,1974,1973
Estas estatísticas em outros países:
AfghanistanAlbaniaAlgeriaAngolaAntigua and BarbudaArab WorldArgentinaArmeniaArubaAustriaAzerbaijanBahamas, TheBahrainBangladeshBarbadosBelarusBelgiumBelizeBeninBermudaBhutanBoliviaBosnia and HerzegovinaBotswanaBrazilBritish Virgin IslandsBrunei DarussalamBulgariaBurkina FasoBurundiCabo VerdeCambodiaCameroonCanadaCaribbean small statesCentral African RepublicCentral Europe and the BalticsChadChileChinaColombiaComorosCongo, Dem. Rep.Congo, Rep.Costa RicaCote d'IvoireCroatiaCubaCyprusCzech RepublicDenmarkDjiboutiDominicaDominican RepublicEarly-demographic dividendEast Asia & PacificEast Asia & Pacific (excluding high income)East Asia & Pacific (IDA & IBRD countries)EcuadorEgypt, Arab Rep.El SalvadorEquatorial GuineaEritreaEstoniaEthiopiaEuro areaEurope & Central AsiaEurope & Central Asia (excluding high income)Europe & Central Asia (IDA & IBRD countries)European UnionFijiFinlandFragile and conflict affected situationsFranceGabonGambia, TheGeorgiaGermanyGhanaGreeceGrenadaGuatemalaGuineaGuinea-BissauGuyanaHaitiHeavily indebted poor countries (HIPC)High incomeHondurasHong Kong SAR, ChinaHungaryIBRD onlyIcelandIDA & IBRD totalIDA blendIDA onlyIDA totalIndiaIndonesiaIran, Islamic Rep.IraqIrelandIsraelItalyJamaicaJapanJordanKazakhstanKenyaKiribatiKorea, Dem. People’s Rep.Korea, Rep.KuwaitKyrgyz RepublicLao PDRLate-demographic dividendLatin America & Caribbean Latin America & Caribbean (excluding high income)Latin America & the Caribbean (IDA & IBRD countries)LatviaLeast developed countries: UN classificationLebanonLesothoLiberiaLibyaLiechtensteinLithuaniaLow & middle incomeLow incomeLower middle incomeLuxembourgMacao SAR, ChinaMacedonia, FYRMadagascarMalawiMalaysiaMaldivesMaliMaltaMarshall IslandsMauritaniaMauritiusMexicoMiddle East & North AfricaMiddle East & North Africa (excluding high income)Middle East & North Africa (IDA & IBRD countries)Middle incomeMoldovaMongoliaMontenegroMoroccoMozambiqueMyanmarNamibiaNauruNepalNetherlandsNew ZealandNicaraguaNigerNigeriaNorwayOECD membersOmanOther small statesPacific island small statesPakistanPalauPanamaPapua New GuineaParaguayPeruPhilippinesPolandPortugalPost-demographic dividendPre-demographic dividendQatarRomaniaRussian FederationRwandaSamoaSan MarinoSao Tome and PrincipeSaudi ArabiaSenegalSerbiaSeychellesSierra LeoneSlovak RepublicSloveniaSmall statesSolomon IslandsSouth AfricaSouth AsiaSouth Asia (IDA & IBRD)South SudanSpainSri LankaSt. Kitts and NevisSt. LuciaSt. Vincent and the GrenadinesSub-Saharan Africa Sub-Saharan Africa (excluding high income)Sub-Saharan Africa (IDA & IBRD countries)SudanSurinameSwazilandSwedenSwitzerlandSyrian Arab RepublicTajikistanTanzaniaThailandTimor-LesteTogoTongaTrinidad and TobagoTunisiaTurkeyTuvaluUgandaUkraineUnited Arab EmiratesUpper middle incomeUruguayUzbekistanVanuatuVenezuela, RBVietnamWest Bank and GazaWorldYemen, Rep.ZambiaZimbabwe Linha do tempo:
Nesta escala de tempo está apresentado um gráfico de 1973 ano até 2015 ano Indonesia. Dados de 1972 ano ausente. O número de observações reais por data: 38.
Fonte (nome):
Indicadores de desenvolvimento mundial
Fonte (organização):
United Nations Educational, Scientific, and Cultural Organization (UNESCO) Institute for Statistics.
Categorias:
Aid Effectiveness, Climate Change, Education
Foi atualizado:
23 abr 2017 ano
Indicadores de alterações dos valores ao longo dos anos
Mínimo:
48.74
1 jan 1977 ano
Máximo:
102.893
1 jan 2015 ano
Na data de observação
Valor
Mudança absoluta
A alteração em relação ao valor anterior
1 jan 1973 ano
51.891
+51.891
0.0%
1 jan 1974 ano
53.09
+1.199
2.31%
1 jan 1975 ano
50.92
-2.17
-4.09%
1 jan 1976 ano
49.288
-1.632
-3.2%
1 jan 1977 ano
48.74
-0.548
-1.11%
1 jan 1978 ano
53.284
+4.544
9.32%
1 jan 1979 ano
56.064
+2.78
5.22%
1 jan 1982 ano
65.428
+9.364
16.7%
1 jan 1983 ano
69.993
+4.565
6.98%
1 jan 1984 ano
75.192
+5.199
7.43%
1 jan 1985 ano
84.663
+9.472
12.6%
1 jan 1986 ano
94.151
+9.488
11.21%
1 jan 1987 ano
96.55
+2.399
2.55%
1 jan 1988 ano
95.825
-0.726
-0.75%
1 jan 1989 ano
95.983
+0.158
0.17%
1 jan 1990 ano
96.182
+0.199
0.21%
1 jan 1991 ano
93.327
-2.855
-2.97%
1 jan 1992 ano
90.273
-3.055
-3.27%
1 jan 1993 ano
88.716
-1.556
-1.72%
1 jan 1994 ano
92.162
+3.445
3.88%
1 jan 1995 ano
94.607
+2.446
2.65%
1 jan 1996 ano
94.531
-0.076
-0.08%
1 jan 1997 ano
93.524
-1.007
-1.07%
1 jan 1998 ano
94.156
+0.632
0.68%
1 jan 2002 ano
93.759
-0.397
-0.42%
1 jan 2003 ano
95.041
+1.282
1.37%
1 jan 2004 ano
95.627
+0.586
0.62%
1 jan 2005 ano
95.533
-0.093
-0.1%
1 jan 2006 ano
94.159
-1.374
-1.44%
1 jan 2007 ano
92.422
-1.737
-1.84%
1 jan 2008 ano
96.535
+4.113
4.45%
1 jan 2009 ano
96.55
+0.015
0.02%
1 jan 2010 ano
98.327
+1.777
1.84%
1 jan 2011 ano
100.248
+1.921
1.95%
1 jan 2012 ano
97.471
-2.777
-2.77%
1 jan 2013 ano
102.535
+5.064
5.2%
1 jan 2014 ano
100.588
-1.947
-1.9%
1 jan 2015 ano
102.893
+2.304
2.29%
Classificação de países por estatísticas atuais por anos


Comentários: