29
/pt/
pt
AIzaSyAYiBZKx7MnpbEhh9jyipgxe19OcubqV5w
April 1, 2024
142244
Greece
GRC
true
2
1
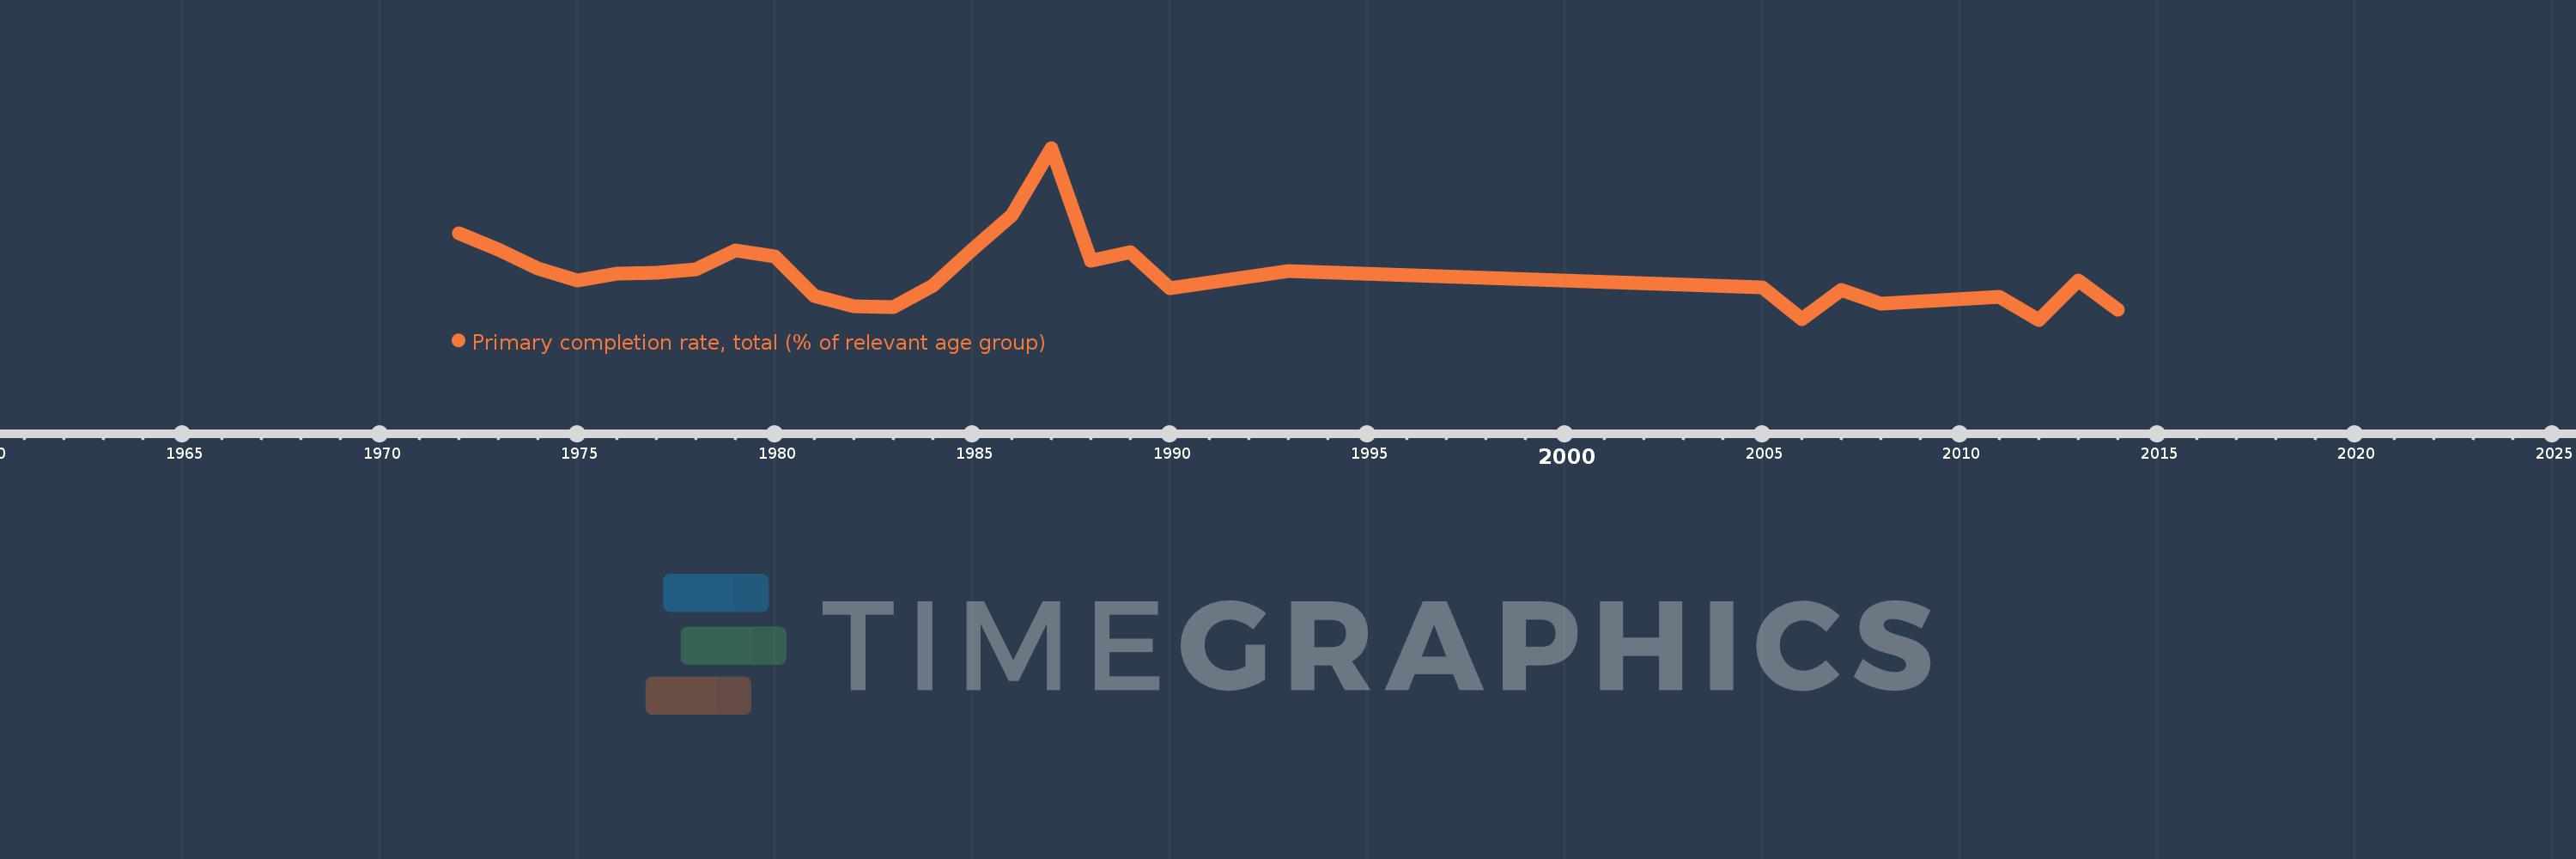
Primary completion rate, total (% of relevant age group)
2014,2013,2012,2011,2008,2007,2006,2005,1993,1990,1989,1988,1987,1986,1985,1984,1983,1982,1981,1980,1979,1978,1977,1976,1975,1974,1973,1972
Estas estatísticas em outros países:
AfghanistanAlbaniaAlgeriaAngolaAntigua and BarbudaArab WorldArgentinaArmeniaArubaAustriaAzerbaijanBahamas, TheBahrainBangladeshBarbadosBelarusBelgiumBelizeBeninBermudaBhutanBoliviaBosnia and HerzegovinaBotswanaBrazilBritish Virgin IslandsBrunei DarussalamBulgariaBurkina FasoBurundiCabo VerdeCambodiaCameroonCanadaCaribbean small statesCentral African RepublicCentral Europe and the BalticsChadChileChinaColombiaComorosCongo, Dem. Rep.Congo, Rep.Costa RicaCote d'IvoireCroatiaCubaCyprusCzech RepublicDenmarkDjiboutiDominicaDominican RepublicEarly-demographic dividendEast Asia & PacificEast Asia & Pacific (excluding high income)East Asia & Pacific (IDA & IBRD countries)EcuadorEgypt, Arab Rep.El SalvadorEquatorial GuineaEritreaEstoniaEthiopiaEuro areaEurope & Central AsiaEurope & Central Asia (excluding high income)Europe & Central Asia (IDA & IBRD countries)European UnionFijiFinlandFragile and conflict affected situationsFranceGabonGambia, TheGeorgiaGermanyGhanaGreeceGrenadaGuatemalaGuineaGuinea-BissauGuyanaHaitiHeavily indebted poor countries (HIPC)High incomeHondurasHong Kong SAR, ChinaHungaryIBRD onlyIcelandIDA & IBRD totalIDA blendIDA onlyIDA totalIndiaIndonesiaIran, Islamic Rep.IraqIrelandIsraelItalyJamaicaJapanJordanKazakhstanKenyaKiribatiKorea, Dem. People’s Rep.Korea, Rep.KuwaitKyrgyz RepublicLao PDRLate-demographic dividendLatin America & Caribbean Latin America & Caribbean (excluding high income)Latin America & the Caribbean (IDA & IBRD countries)LatviaLeast developed countries: UN classificationLebanonLesothoLiberiaLibyaLiechtensteinLithuaniaLow & middle incomeLow incomeLower middle incomeLuxembourgMacao SAR, ChinaMacedonia, FYRMadagascarMalawiMalaysiaMaldivesMaliMaltaMarshall IslandsMauritaniaMauritiusMexicoMiddle East & North AfricaMiddle East & North Africa (excluding high income)Middle East & North Africa (IDA & IBRD countries)Middle incomeMoldovaMongoliaMontenegroMoroccoMozambiqueMyanmarNamibiaNauruNepalNetherlandsNew ZealandNicaraguaNigerNigeriaNorwayOECD membersOmanOther small statesPacific island small statesPakistanPalauPanamaPapua New GuineaParaguayPeruPhilippinesPolandPortugalPost-demographic dividendPre-demographic dividendQatarRomaniaRussian FederationRwandaSamoaSan MarinoSao Tome and PrincipeSaudi ArabiaSenegalSerbiaSeychellesSierra LeoneSlovak RepublicSloveniaSmall statesSolomon IslandsSouth AfricaSouth AsiaSouth Asia (IDA & IBRD)South SudanSpainSri LankaSt. Kitts and NevisSt. LuciaSt. Vincent and the GrenadinesSub-Saharan Africa Sub-Saharan Africa (excluding high income)Sub-Saharan Africa (IDA & IBRD countries)SudanSurinameSwazilandSwedenSwitzerlandSyrian Arab RepublicTajikistanTanzaniaThailandTimor-LesteTogoTongaTrinidad and TobagoTunisiaTurkeyTuvaluUgandaUkraineUnited Arab EmiratesUpper middle incomeUruguayUzbekistanVanuatuVenezuela, RBVietnamWest Bank and GazaWorldYemen, Rep.ZambiaZimbabwe Linha do tempo:
Nesta escala de tempo está apresentado um gráfico de 1972 ano até 2014 ano Greece. Dados de 1971 ano ausente. O número de observações reais por data: 28.
Fonte (nome):
Indicadores de desenvolvimento mundial
Fonte (organização):
United Nations Educational, Scientific, and Cultural Organization (UNESCO) Institute for Statistics.
Categorias:
Aid Effectiveness, Climate Change, Education
Foi atualizado:
23 abr 2017 ano
Indicadores de alterações dos valores ao longo dos anos
Mínimo:
96.213
1 jan 2012 ano
Máximo:
110.806
1 jan 1987 ano
Na data de observação
Valor
Mudança absoluta
A alteração em relação ao valor anterior
1 jan 1972 ano
103.547
+103.547
0.0%
1 jan 1973 ano
102.17
-1.378
-1.33%
1 jan 1974 ano
100.588
-1.581
-1.55%
1 jan 1975 ano
99.535
-1.053
-1.05%
1 jan 1976 ano
100.12
+0.585
0.59%
1 jan 1977 ano
100.216
+0.096
0.1%
1 jan 1978 ano
100.476
+0.26
0.26%
1 jan 1979 ano
102.134
+1.659
1.65%
1 jan 1980 ano
101.611
-0.523
-0.51%
1 jan 1981 ano
98.248
-3.363
-3.31%
1 jan 1982 ano
97.339
-0.909
-0.92%
1 jan 1983 ano
97.321
-0.019
-0.02%
1 jan 1984 ano
99.101
+1.781
1.83%
1 jan 1985 ano
102.176
+3.075
3.1%
1 jan 1986 ano
105.098
+2.922
2.86%
1 jan 1987 ano
110.806
+5.708
5.43%
1 jan 1988 ano
101.234
-9.573
-8.64%
1 jan 1989 ano
101.931
+0.697
0.69%
1 jan 1990 ano
98.867
-3.064
-3.01%
1 jan 1993 ano
100.317
+1.451
1.47%
1 jan 2005 ano
98.94
-1.377
-1.37%
1 jan 2006 ano
96.237
-2.702
-2.73%
1 jan 2007 ano
98.762
+2.525
2.62%
1 jan 2008 ano
97.599
-1.163
-1.18%
1 jan 2011 ano
98.191
+0.592
0.61%
1 jan 2012 ano
96.213
-1.978
-2.01%
1 jan 2013 ano
99.513
+3.299
3.43%
1 jan 2014 ano
97.085
-2.427
-2.44%
Classificação de países por estatísticas atuais por anos


Comentários: