29
/it/
it
AIzaSyAYiBZKx7MnpbEhh9jyipgxe19OcubqV5w
April 1, 2024
95455
Burkina Faso
BFA
true
2
1
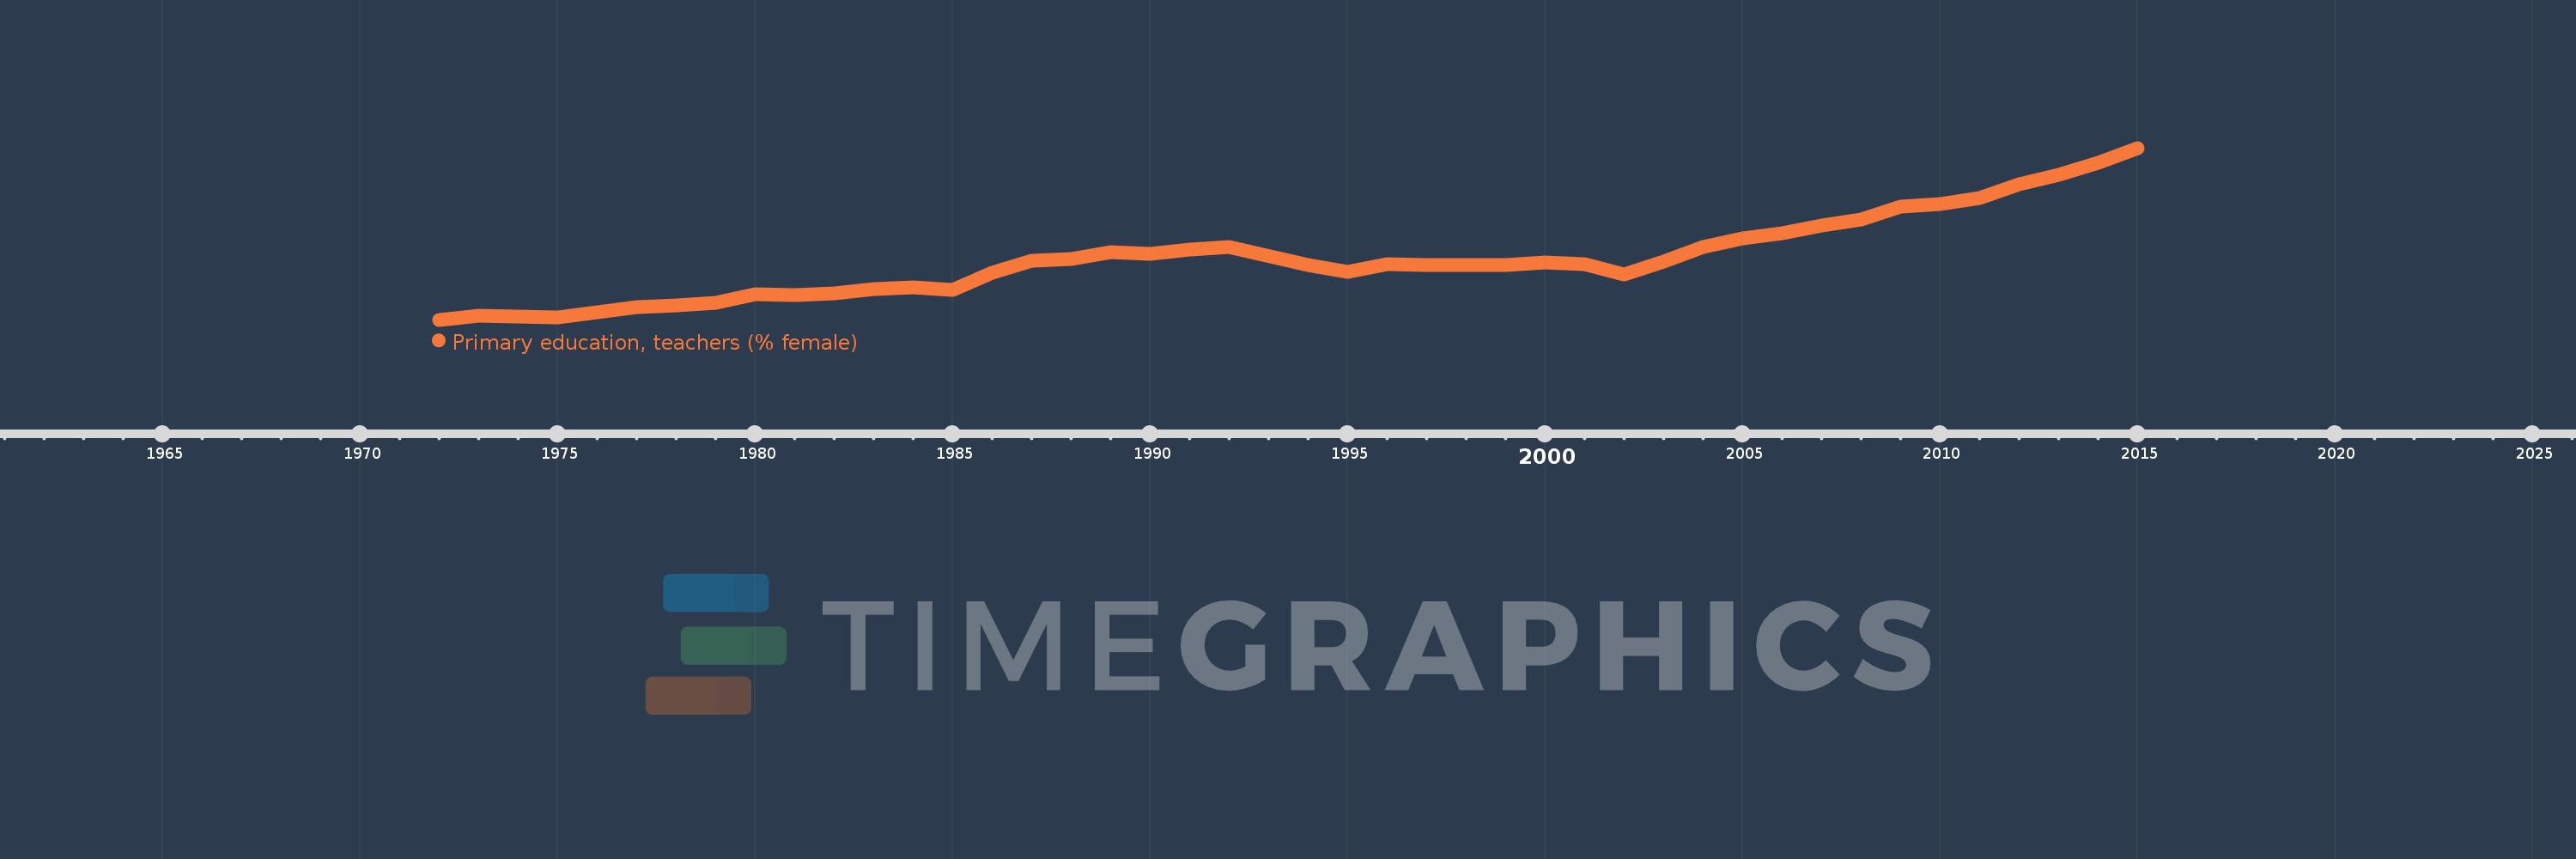
Primary education, teachers (% female)
2015,2014,2013,2012,2011,2010,2009,2008,2007,2006,2005,2004,2003,2002,2001,2000,1999,1997,1996,1995,1994,1992,1991,1990,1989,1988,1987,1986,1985,1984,1983,1982,1981,1980,1979,1978,1977,1976,1975,1973,1972
Queste statistiche in altri paesi:
AfghanistanAlbaniaAlgeriaAndorraAngolaAntigua and BarbudaArab WorldArgentinaArmeniaArubaAustraliaAustriaAzerbaijanBahamas, TheBahrainBangladeshBarbadosBelarusBelgiumBelizeBeninBermudaBhutanBoliviaBosnia and HerzegovinaBotswanaBrazilBritish Virgin IslandsBrunei DarussalamBulgariaBurkina FasoBurundiCabo VerdeCambodiaCameroonCanadaCaribbean small statesCayman IslandsCentral African RepublicCentral Europe and the BalticsChadChileChinaColombiaComorosCongo, Dem. Rep.Congo, Rep.Costa RicaCote d'IvoireCroatiaCubaCyprusCzech RepublicDenmarkDjiboutiDominicaDominican RepublicEarly-demographic dividendEast Asia & PacificEast Asia & Pacific (excluding high income)East Asia & Pacific (IDA & IBRD countries)EcuadorEgypt, Arab Rep.El SalvadorEquatorial GuineaEritreaEstoniaEthiopiaEuro areaEurope & Central AsiaEurope & Central Asia (excluding high income)Europe & Central Asia (IDA & IBRD countries)European UnionFijiFinlandFragile and conflict affected situationsFranceGabonGambia, TheGeorgiaGermanyGhanaGibraltarGreeceGrenadaGuatemalaGuineaGuinea-BissauGuyanaHaitiHeavily indebted poor countries (HIPC)High incomeHondurasHong Kong SAR, ChinaHungaryIBRD onlyIcelandIDA & IBRD totalIDA blendIDA onlyIDA totalIndiaIndonesiaIran, Islamic Rep.IraqIrelandIsraelItalyJamaicaJapanJordanKazakhstanKenyaKiribatiKorea, Dem. People’s Rep.Korea, Rep.KuwaitKyrgyz RepublicLao PDRLate-demographic dividendLatin America & Caribbean Latin America & Caribbean (excluding high income)Latin America & the Caribbean (IDA & IBRD countries)LatviaLeast developed countries: UN classificationLebanonLesothoLiberiaLibyaLiechtensteinLithuaniaLow & middle incomeLow incomeLower middle incomeLuxembourgMacao SAR, ChinaMacedonia, FYRMadagascarMalawiMalaysiaMaldivesMaliMaltaMarshall IslandsMauritaniaMauritiusMexicoMiddle East & North AfricaMiddle East & North Africa (excluding high income)Middle East & North Africa (IDA & IBRD countries)Middle incomeMoldovaMonacoMongoliaMoroccoMozambiqueMyanmarNamibiaNauruNepalNetherlandsNew ZealandNicaraguaNigerNigeriaNorth AmericaNorwayOECD membersOmanOther small statesPacific island small statesPakistanPalauPanamaPapua New GuineaParaguayPeruPhilippinesPolandPortugalPost-demographic dividendPre-demographic dividendPuerto RicoQatarRomaniaRussian FederationRwandaSamoaSan MarinoSao Tome and PrincipeSaudi ArabiaSenegalSerbiaSeychellesSierra LeoneSingaporeSint Maarten (Dutch part)Slovak RepublicSloveniaSmall statesSolomon IslandsSomaliaSouth AfricaSouth AsiaSouth Asia (IDA & IBRD)South SudanSpainSri LankaSt. Kitts and NevisSt. LuciaSt. Vincent and the GrenadinesSub-Saharan Africa Sub-Saharan Africa (excluding high income)Sub-Saharan Africa (IDA & IBRD countries)SudanSurinameSwazilandSwedenSwitzerlandSyrian Arab RepublicTajikistanTanzaniaThailandTimor-LesteTogoTongaTrinidad and TobagoTunisiaTurkeyTurks and Caicos IslandsTuvaluUgandaUkraineUnited Arab EmiratesUnited KingdomUnited StatesUpper middle incomeUruguayUzbekistanVanuatuVenezuela, RBVietnamWest Bank and GazaWorldYemen, Rep.ZambiaZimbabwe Linea del tempo:
Questa scala temporale mostra un grafico dal 1972 anno al 2015 anno. Burkina Faso. I dati fino ad 1971 anno non disponibili. Il numero di osservazioni attuali secondo i date: 41.
La fonte (nome):
Indicatori dello sviluppo mondiale
La fonte (organizzazione):
United Nations Educational, Scientific, and Cultural Organization (UNESCO) Institute for Statistics.
Categorie:
Education, Gender
sono stati aggiornati
23 apr 2017 anni
Indicatori delle variazioni dei valori per anni
Minima:
16.287
1 gen 1972 anni
Massimo:
41.656
1 gen 2015 anni
Alla data di osservazione
Valore
Variazione assoluta
La variazione rispetto al valore precedente
1 gen 1972 anni
16.287
+16.287
0.0%
1 gen 1973 anni
16.835
+0.548
3.37%
1 gen 1975 anni
16.685
-0.15
-0.89%
1 gen 1976 anni
17.348
+0.663
3.98%
1 gen 1977 anni
18.151
+0.803
4.63%
1 gen 1978 anni
18.374
+0.222
1.23%
1 gen 1979 anni
18.82
+0.446
2.43%
1 gen 1980 anni
20.074
+1.253
6.66%
1 gen 1981 anni
19.914
-0.16
-0.79%
1 gen 1982 anni
20.189
+0.275
1.38%
1 gen 1983 anni
20.833
+0.644
3.19%
1 gen 1984 anni
21.069
+0.236
1.13%
1 gen 1985 anni
20.684
-0.385
-1.83%
1 gen 1986 anni
23.189
+2.505
12.11%
1 gen 1987 anni
24.988
+1.799
7.76%
1 gen 1988 anni
25.26
+0.272
1.09%
1 gen 1989 anni
26.325
+1.065
4.22%
1 gen 1990 anni
26.006
-0.319
-1.21%
1 gen 1991 anni
26.61
+0.604
2.32%
1 gen 1992 anni
27.013
+0.403
1.52%
1 gen 1994 anni
24.416
-2.598
-9.62%
1 gen 1995 anni
23.379
-1.037
-4.25%
1 gen 1996 anni
24.486
+1.108
4.74%
1 gen 1997 anni
24.307
-0.179
-0.73%
1 gen 1999 anni
24.402
+0.095
0.39%
1 gen 2000 anni
24.694
+0.292
1.2%
1 gen 2001 anni
24.497
-0.197
-0.8%
1 gen 2002 anni
22.939
-1.558
-6.36%
1 gen 2003 anni
24.85
+1.911
8.33%
1 gen 2004 anni
27.025
+2.175
8.75%
1 gen 2005 anni
28.267
+1.242
4.59%
1 gen 2006 anni
29.059
+0.793
2.8%
1 gen 2007 anni
30.259
+1.2
4.13%
1 gen 2008 anni
31.029
+0.769
2.54%
1 gen 2009 anni
32.931
+1.902
6.13%
1 gen 2010 anni
33.381
+0.45
1.37%
1 gen 2011 anni
34.302
+0.92
2.76%
1 gen 2012 anni
36.314
+2.013
5.87%
1 gen 2013 anni
37.652
+1.338
3.68%
1 gen 2014 anni
39.492
+1.839
4.89%
1 gen 2015 anni
41.656
+2.164
5.48%
Classificazione dei paesi secondo i statistiche attuali per anni


Commenti: