29
/it/
it
AIzaSyAYiBZKx7MnpbEhh9jyipgxe19OcubqV5w
April 1, 2024
37727
IDA & IBRD total
IBT
false
2
1
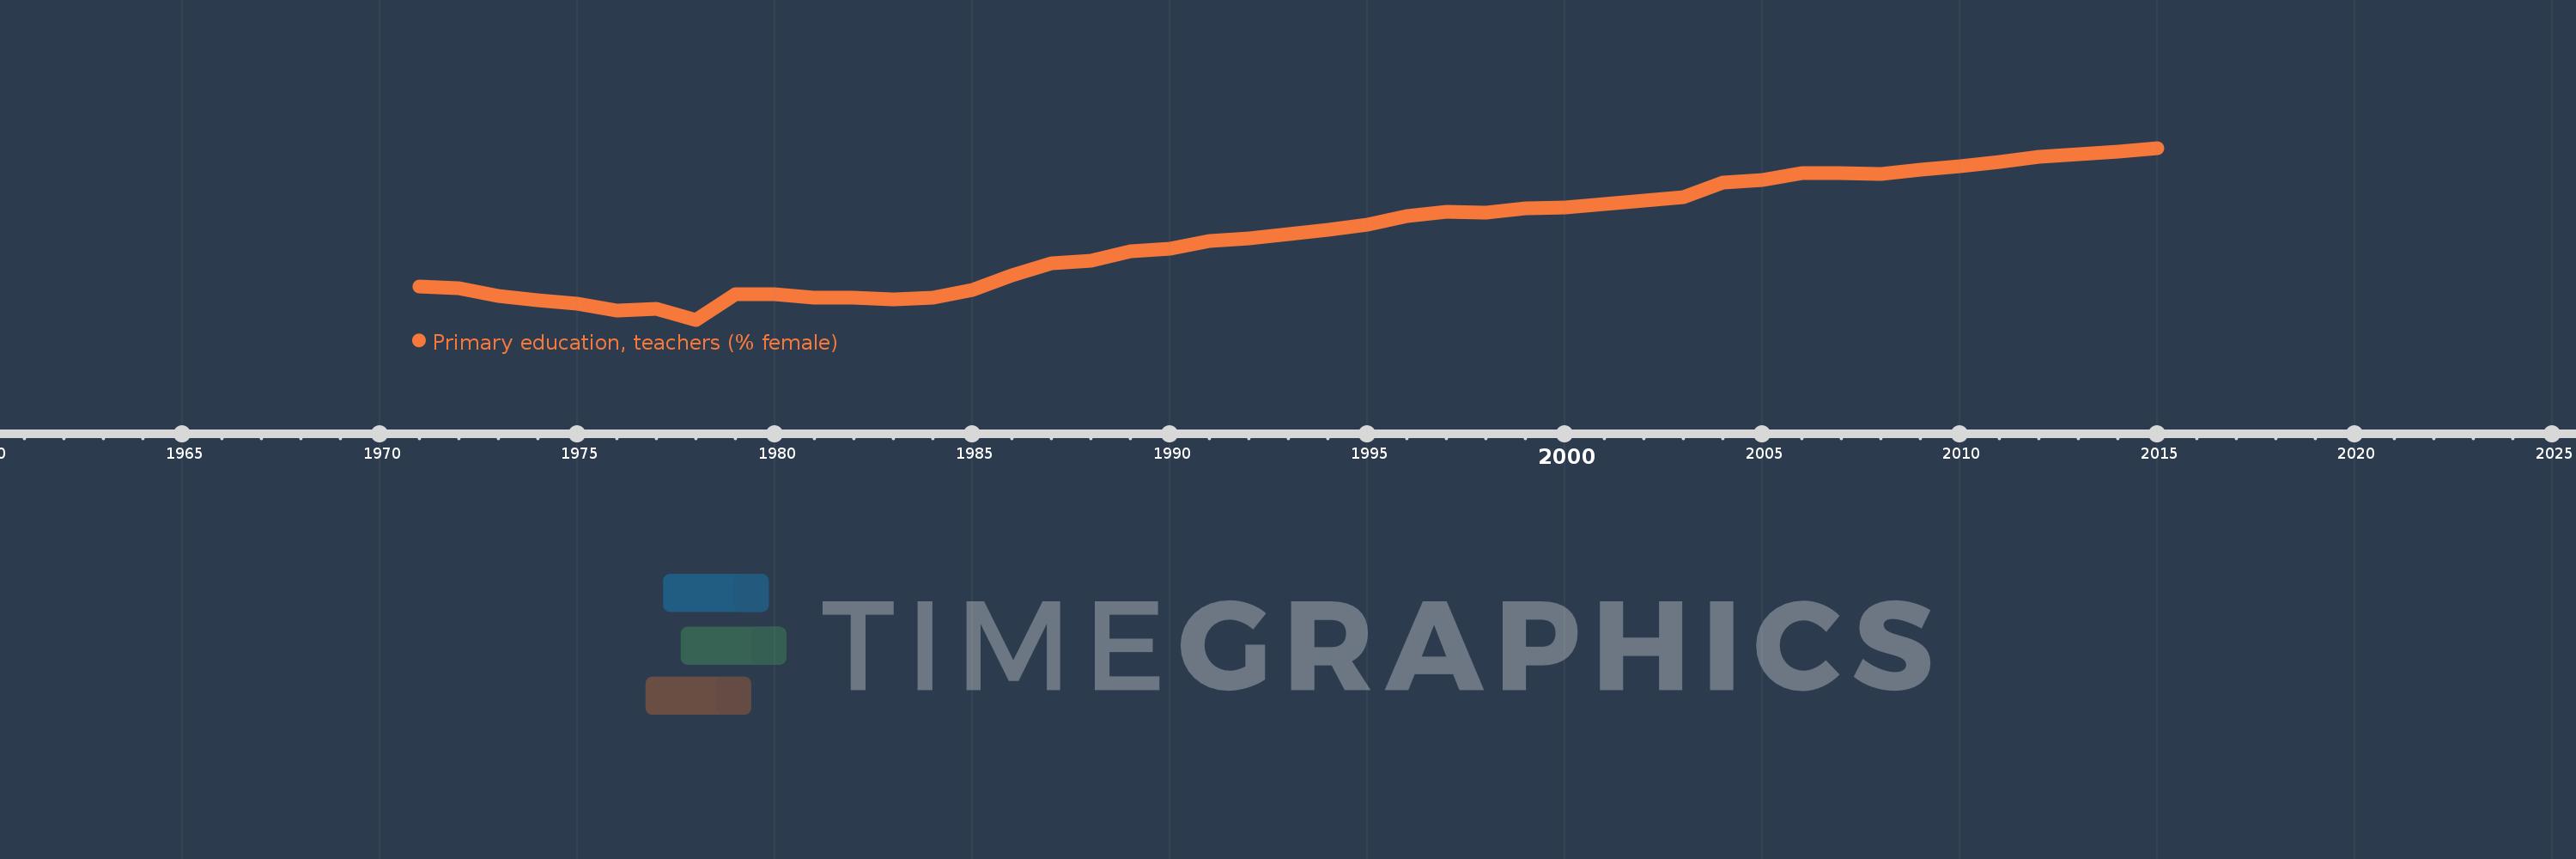
Primary education, teachers (% female)
2015,2014,2013,2012,2011,2010,2009,2008,2007,2006,2005,2004,2003,2002,2001,2000,1999,1998,1997,1996,1995,1994,1993,1992,1991,1990,1989,1988,1987,1986,1985,1984,1983,1982,1981,1980,1979,1978,1977,1976,1975,1974,1973,1972,1971
Queste statistiche in altri paesi:
AfghanistanAlbaniaAlgeriaAndorraAngolaAntigua and BarbudaArab WorldArgentinaArmeniaArubaAustraliaAustriaAzerbaijanBahamas, TheBahrainBangladeshBarbadosBelarusBelgiumBelizeBeninBermudaBhutanBoliviaBosnia and HerzegovinaBotswanaBrazilBritish Virgin IslandsBrunei DarussalamBulgariaBurkina FasoBurundiCabo VerdeCambodiaCameroonCanadaCaribbean small statesCayman IslandsCentral African RepublicCentral Europe and the BalticsChadChileChinaColombiaComorosCongo, Dem. Rep.Congo, Rep.Costa RicaCote d'IvoireCroatiaCubaCyprusCzech RepublicDenmarkDjiboutiDominicaDominican RepublicEarly-demographic dividendEast Asia & PacificEast Asia & Pacific (excluding high income)East Asia & Pacific (IDA & IBRD countries)EcuadorEgypt, Arab Rep.El SalvadorEquatorial GuineaEritreaEstoniaEthiopiaEuro areaEurope & Central AsiaEurope & Central Asia (excluding high income)Europe & Central Asia (IDA & IBRD countries)European UnionFijiFinlandFragile and conflict affected situationsFranceGabonGambia, TheGeorgiaGermanyGhanaGibraltarGreeceGrenadaGuatemalaGuineaGuinea-BissauGuyanaHaitiHeavily indebted poor countries (HIPC)High incomeHondurasHong Kong SAR, ChinaHungaryIBRD onlyIcelandIDA & IBRD totalIDA blendIDA onlyIDA totalIndiaIndonesiaIran, Islamic Rep.IraqIrelandIsraelItalyJamaicaJapanJordanKazakhstanKenyaKiribatiKorea, Dem. People’s Rep.Korea, Rep.KuwaitKyrgyz RepublicLao PDRLate-demographic dividendLatin America & Caribbean Latin America & Caribbean (excluding high income)Latin America & the Caribbean (IDA & IBRD countries)LatviaLeast developed countries: UN classificationLebanonLesothoLiberiaLibyaLiechtensteinLithuaniaLow & middle incomeLow incomeLower middle incomeLuxembourgMacao SAR, ChinaMacedonia, FYRMadagascarMalawiMalaysiaMaldivesMaliMaltaMarshall IslandsMauritaniaMauritiusMexicoMiddle East & North AfricaMiddle East & North Africa (excluding high income)Middle East & North Africa (IDA & IBRD countries)Middle incomeMoldovaMonacoMongoliaMoroccoMozambiqueMyanmarNamibiaNauruNepalNetherlandsNew ZealandNicaraguaNigerNigeriaNorth AmericaNorwayOECD membersOmanOther small statesPacific island small statesPakistanPalauPanamaPapua New GuineaParaguayPeruPhilippinesPolandPortugalPost-demographic dividendPre-demographic dividendPuerto RicoQatarRomaniaRussian FederationRwandaSamoaSan MarinoSao Tome and PrincipeSaudi ArabiaSenegalSerbiaSeychellesSierra LeoneSingaporeSint Maarten (Dutch part)Slovak RepublicSloveniaSmall statesSolomon IslandsSomaliaSouth AfricaSouth AsiaSouth Asia (IDA & IBRD)South SudanSpainSri LankaSt. Kitts and NevisSt. LuciaSt. Vincent and the GrenadinesSub-Saharan Africa Sub-Saharan Africa (excluding high income)Sub-Saharan Africa (IDA & IBRD countries)SudanSurinameSwazilandSwedenSwitzerlandSyrian Arab RepublicTajikistanTanzaniaThailandTimor-LesteTogoTongaTrinidad and TobagoTunisiaTurkeyTurks and Caicos IslandsTuvaluUgandaUkraineUnited Arab EmiratesUnited KingdomUnited StatesUpper middle incomeUruguayUzbekistanVanuatuVenezuela, RBVietnamWest Bank and GazaWorldYemen, Rep.ZambiaZimbabwe Linea del tempo:
Questa scala temporale mostra un grafico dal 1971 anno al 2015 anno. IDA & IBRD total. I dati fino ad 1970 anno non disponibili. Il numero di osservazioni attuali secondo i date: 45.
La fonte (nome):
Indicatori dello sviluppo mondiale
La fonte (organizzazione):
United Nations Educational, Scientific, and Cultural Organization (UNESCO) Institute for Statistics.
Categorie:
Education, Gender
sono stati aggiornati
23 apr 2017 anni
Indicatori delle variazioni dei valori per anni
Minima:
44.327
1 gen 1978 anni
Massimo:
59.969
1 gen 2015 anni
Alla data di osservazione
Valore
Variazione assoluta
La variazione rispetto al valore precedente
1 gen 1971 anni
47.356
+47.356
0.0%
1 gen 1972 anni
47.168
-0.188
-0.4%
1 gen 1973 anni
46.487
-0.681
-1.44%
1 gen 1974 anni
46.117
-0.37
-0.8%
1 gen 1975 anni
45.753
-0.364
-0.79%
1 gen 1976 anni
45.184
-0.569
-1.24%
1 gen 1977 anni
45.306
+0.122
0.27%
1 gen 1978 anni
44.327
-0.978
-2.16%
1 gen 1979 anni
46.619
+2.291
5.17%
1 gen 1980 anni
46.687
+0.069
0.15%
1 gen 1981 anni
46.336
-0.352
-0.75%
1 gen 1982 anni
46.37
+0.034
0.07%
1 gen 1983 anni
46.16
-0.21
-0.45%
1 gen 1984 anni
46.3
+0.14
0.3%
1 gen 1985 anni
47.007
+0.707
1.53%
1 gen 1986 anni
48.359
+1.353
2.88%
1 gen 1987 anni
49.454
+1.095
2.26%
1 gen 1988 anni
49.701
+0.247
0.5%
1 gen 1989 anni
50.535
+0.834
1.68%
1 gen 1990 anni
50.776
+0.241
0.48%
1 gen 1991 anni
51.524
+0.748
1.47%
1 gen 1992 anni
51.7
+0.176
0.34%
1 gen 1993 anni
52.151
+0.451
0.87%
1 gen 1994 anni
52.526
+0.375
0.72%
1 gen 1995 anni
53.019
+0.493
0.94%
1 gen 1996 anni
53.773
+0.754
1.42%
1 gen 1997 anni
54.15
+0.376
0.7%
1 gen 1998 anni
54.062
-0.087
-0.16%
1 gen 1999 anni
54.455
+0.393
0.73%
1 gen 2000 anni
54.514
+0.059
0.11%
1 gen 2001 anni
54.84
+0.326
0.6%
1 gen 2002 anni
55.209
+0.369
0.67%
1 gen 2003 anni
55.514
+0.305
0.55%
1 gen 2004 anni
56.83
+1.316
2.37%
1 gen 2005 anni
57.074
+0.244
0.43%
1 gen 2006 anni
57.684
+0.61
1.07%
1 gen 2007 anni
57.69
+0.007
0.01%
1 gen 2008 anni
57.582
-0.108
-0.19%
1 gen 2009 anni
57.96
+0.378
0.66%
1 gen 2010 anni
58.274
+0.314
0.54%
1 gen 2011 anni
58.702
+0.428
0.73%
1 gen 2012 anni
59.182
+0.48
0.82%
1 gen 2013 anni
59.421
+0.238
0.4%
1 gen 2014 anni
59.659
+0.239
0.4%
1 gen 2015 anni
59.969
+0.309
0.52%
Classificazione dei paesi secondo i statistiche attuali per anni


Commenti: