29
/it/
it
AIzaSyAYiBZKx7MnpbEhh9jyipgxe19OcubqV5w
April 1, 2024
39476
IDA only
IDX
false
2
1
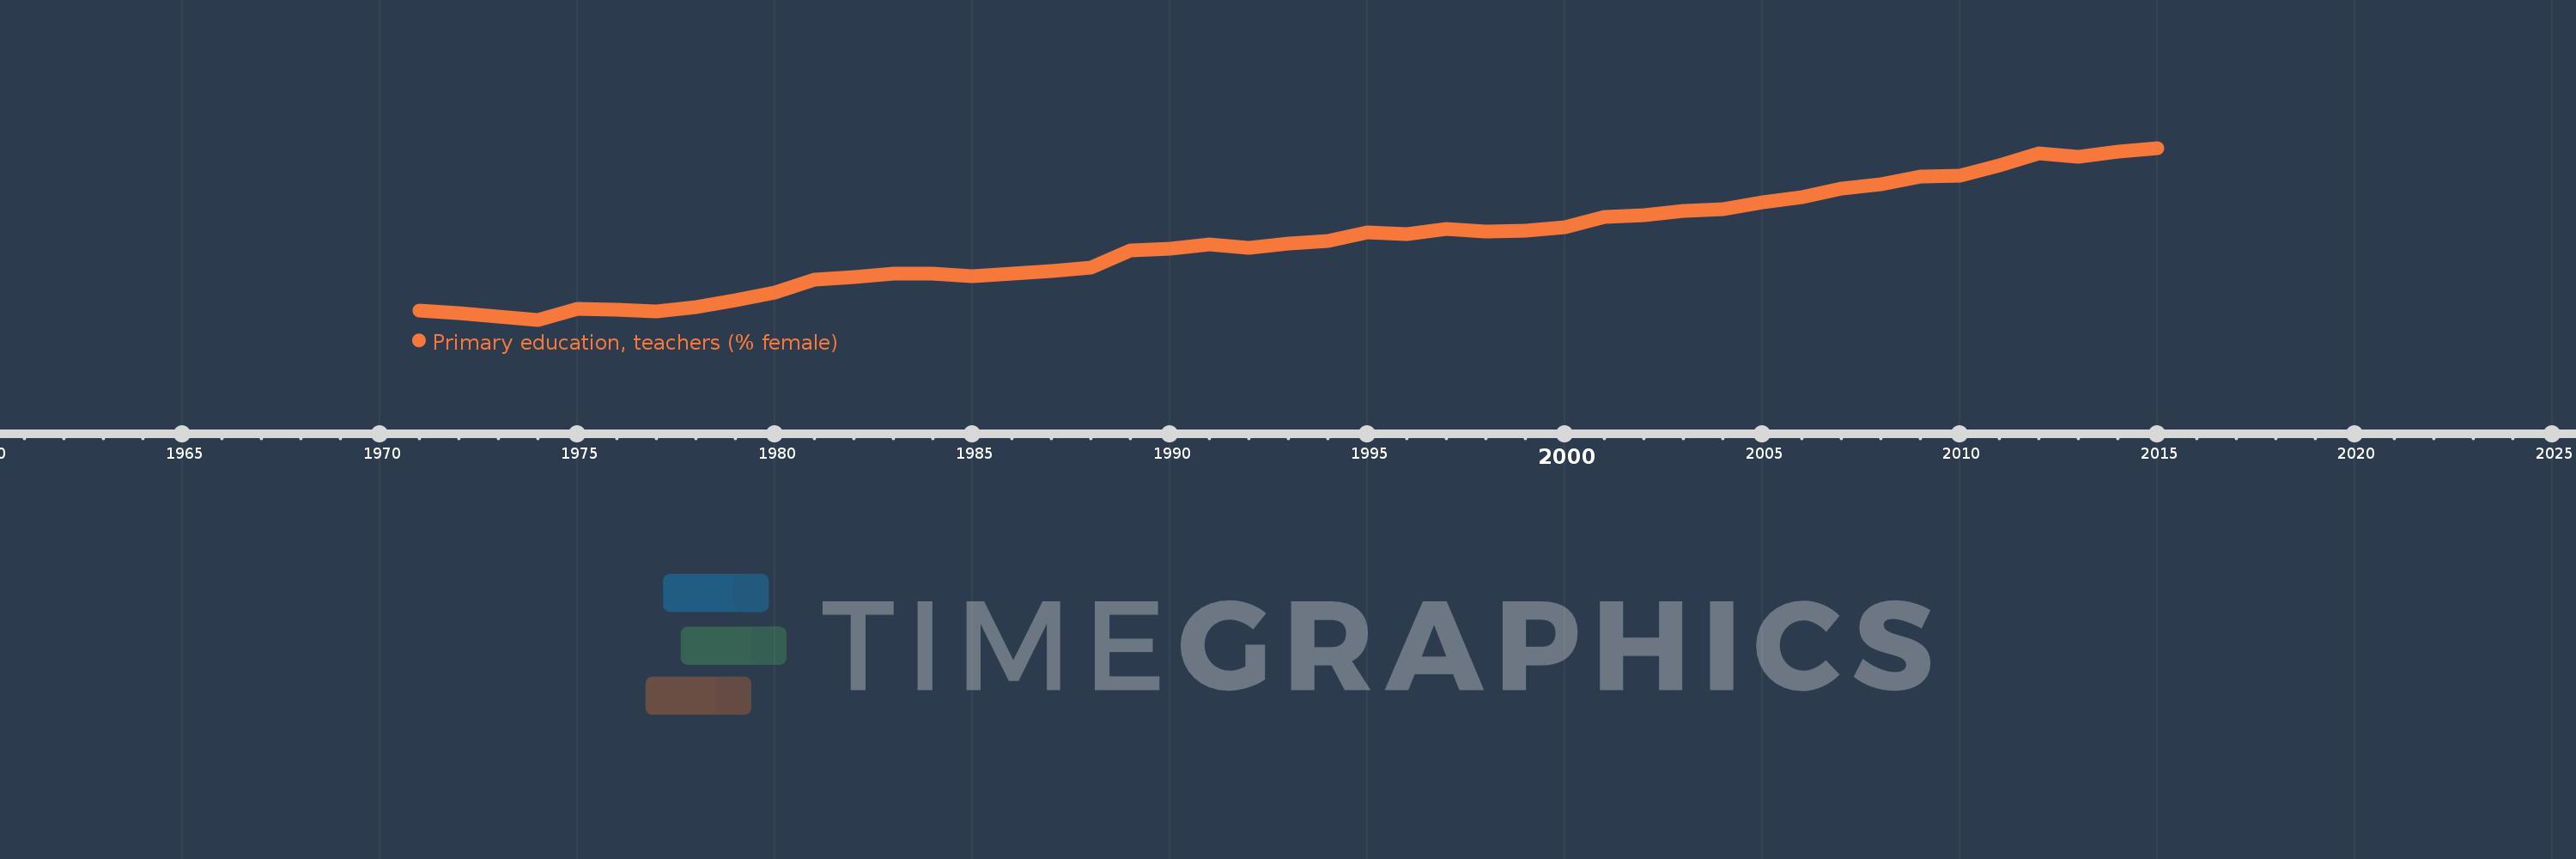
Primary education, teachers (% female)
2015,2014,2013,2012,2011,2010,2009,2008,2007,2006,2005,2004,2003,2002,2001,2000,1999,1998,1997,1996,1995,1994,1993,1992,1991,1990,1989,1988,1987,1986,1985,1984,1983,1982,1981,1980,1979,1978,1977,1976,1975,1974,1973,1972,1971
Queste statistiche in altri paesi:
AfghanistanAlbaniaAlgeriaAndorraAngolaAntigua and BarbudaArab WorldArgentinaArmeniaArubaAustraliaAustriaAzerbaijanBahamas, TheBahrainBangladeshBarbadosBelarusBelgiumBelizeBeninBermudaBhutanBoliviaBosnia and HerzegovinaBotswanaBrazilBritish Virgin IslandsBrunei DarussalamBulgariaBurkina FasoBurundiCabo VerdeCambodiaCameroonCanadaCaribbean small statesCayman IslandsCentral African RepublicCentral Europe and the BalticsChadChileChinaColombiaComorosCongo, Dem. Rep.Congo, Rep.Costa RicaCote d'IvoireCroatiaCubaCyprusCzech RepublicDenmarkDjiboutiDominicaDominican RepublicEarly-demographic dividendEast Asia & PacificEast Asia & Pacific (excluding high income)East Asia & Pacific (IDA & IBRD countries)EcuadorEgypt, Arab Rep.El SalvadorEquatorial GuineaEritreaEstoniaEthiopiaEuro areaEurope & Central AsiaEurope & Central Asia (excluding high income)Europe & Central Asia (IDA & IBRD countries)European UnionFijiFinlandFragile and conflict affected situationsFranceGabonGambia, TheGeorgiaGermanyGhanaGibraltarGreeceGrenadaGuatemalaGuineaGuinea-BissauGuyanaHaitiHeavily indebted poor countries (HIPC)High incomeHondurasHong Kong SAR, ChinaHungaryIBRD onlyIcelandIDA & IBRD totalIDA blendIDA onlyIDA totalIndiaIndonesiaIran, Islamic Rep.IraqIrelandIsraelItalyJamaicaJapanJordanKazakhstanKenyaKiribatiKorea, Dem. People’s Rep.Korea, Rep.KuwaitKyrgyz RepublicLao PDRLate-demographic dividendLatin America & Caribbean Latin America & Caribbean (excluding high income)Latin America & the Caribbean (IDA & IBRD countries)LatviaLeast developed countries: UN classificationLebanonLesothoLiberiaLibyaLiechtensteinLithuaniaLow & middle incomeLow incomeLower middle incomeLuxembourgMacao SAR, ChinaMacedonia, FYRMadagascarMalawiMalaysiaMaldivesMaliMaltaMarshall IslandsMauritaniaMauritiusMexicoMiddle East & North AfricaMiddle East & North Africa (excluding high income)Middle East & North Africa (IDA & IBRD countries)Middle incomeMoldovaMonacoMongoliaMoroccoMozambiqueMyanmarNamibiaNauruNepalNetherlandsNew ZealandNicaraguaNigerNigeriaNorth AmericaNorwayOECD membersOmanOther small statesPacific island small statesPakistanPalauPanamaPapua New GuineaParaguayPeruPhilippinesPolandPortugalPost-demographic dividendPre-demographic dividendPuerto RicoQatarRomaniaRussian FederationRwandaSamoaSan MarinoSao Tome and PrincipeSaudi ArabiaSenegalSerbiaSeychellesSierra LeoneSingaporeSint Maarten (Dutch part)Slovak RepublicSloveniaSmall statesSolomon IslandsSomaliaSouth AfricaSouth AsiaSouth Asia (IDA & IBRD)South SudanSpainSri LankaSt. Kitts and NevisSt. LuciaSt. Vincent and the GrenadinesSub-Saharan Africa Sub-Saharan Africa (excluding high income)Sub-Saharan Africa (IDA & IBRD countries)SudanSurinameSwazilandSwedenSwitzerlandSyrian Arab RepublicTajikistanTanzaniaThailandTimor-LesteTogoTongaTrinidad and TobagoTunisiaTurkeyTurks and Caicos IslandsTuvaluUgandaUkraineUnited Arab EmiratesUnited KingdomUnited StatesUpper middle incomeUruguayUzbekistanVanuatuVenezuela, RBVietnamWest Bank and GazaWorldYemen, Rep.ZambiaZimbabwe Linea del tempo:
Questa scala temporale mostra un grafico dal 1971 anno al 2015 anno. IDA only. I dati fino ad 1970 anno non disponibili. Il numero di osservazioni attuali secondo i date: 45.
La fonte (nome):
Indicatori dello sviluppo mondiale
La fonte (organizzazione):
United Nations Educational, Scientific, and Cultural Organization (UNESCO) Institute for Statistics.
Categorie:
Education, Gender
sono stati aggiornati
23 apr 2017 anni
Indicatori delle variazioni dei valori per anni
Minima:
30.077
1 gen 1974 anni
Massimo:
44.962
1 gen 2015 anni
Alla data di osservazione
Valore
Variazione assoluta
La variazione rispetto al valore precedente
1 gen 1971 anni
30.898
+30.898
0.0%
1 gen 1972 anni
30.684
-0.214
-0.69%
1 gen 1973 anni
30.351
-0.333
-1.09%
1 gen 1974 anni
30.077
-0.273
-0.9%
1 gen 1975 anni
30.992
+0.915
3.04%
1 gen 1976 anni
30.916
-0.076
-0.24%
1 gen 1977 anni
30.779
-0.138
-0.45%
1 gen 1978 anni
31.162
+0.384
1.25%
1 gen 1979 anni
31.757
+0.595
1.91%
1 gen 1980 anni
32.443
+0.686
2.16%
1 gen 1981 anni
33.535
+1.092
3.37%
1 gen 1982 anni
33.792
+0.257
0.77%
1 gen 1983 anni
34.048
+0.256
0.76%
1 gen 1984 anni
34.08
+0.032
0.09%
1 gen 1985 anni
33.84
-0.24
-0.7%
1 gen 1986 anni
34.049
+0.209
0.62%
1 gen 1987 anni
34.279
+0.23
0.68%
1 gen 1988 anni
34.598
+0.318
0.93%
1 gen 1989 anni
36.089
+1.492
4.31%
1 gen 1990 anni
36.234
+0.145
0.4%
1 gen 1991 anni
36.57
+0.336
0.93%
1 gen 1992 anni
36.287
-0.283
-0.77%
1 gen 1993 anni
36.677
+0.39
1.08%
1 gen 1994 anni
36.921
+0.244
0.67%
1 gen 1995 anni
37.617
+0.695
1.88%
1 gen 1996 anni
37.47
-0.146
-0.39%
1 gen 1997 anni
37.94
+0.47
1.25%
1 gen 1998 anni
37.751
-0.19
-0.5%
1 gen 1999 anni
37.78
+0.03
0.08%
1 gen 2000 anni
38.126
+0.346
0.92%
1 gen 2001 anni
38.971
+0.845
2.22%
1 gen 2002 anni
39.155
+0.184
0.47%
1 gen 2003 anni
39.478
+0.323
0.82%
1 gen 2004 anni
39.671
+0.193
0.49%
1 gen 2005 anni
40.231
+0.561
1.41%
1 gen 2006 anni
40.673
+0.442
1.1%
1 gen 2007 anni
41.424
+0.752
1.85%
1 gen 2008 anni
41.829
+0.404
0.98%
1 gen 2009 anni
42.473
+0.644
1.54%
1 gen 2010 anni
42.549
+0.076
0.18%
1 gen 2011 anni
43.459
+0.911
2.14%
1 gen 2012 anni
44.503
+1.044
2.4%
1 gen 2013 anni
44.183
-0.32
-0.72%
1 gen 2014 anni
44.628
+0.445
1.01%
1 gen 2015 anni
44.962
+0.333
0.75%
Classificazione dei paesi secondo i statistiche attuali per anni


Commenti: