29
/it/
it
AIzaSyAYiBZKx7MnpbEhh9jyipgxe19OcubqV5w
April 1, 2024
30229
Euro area
EMU
false
2
1
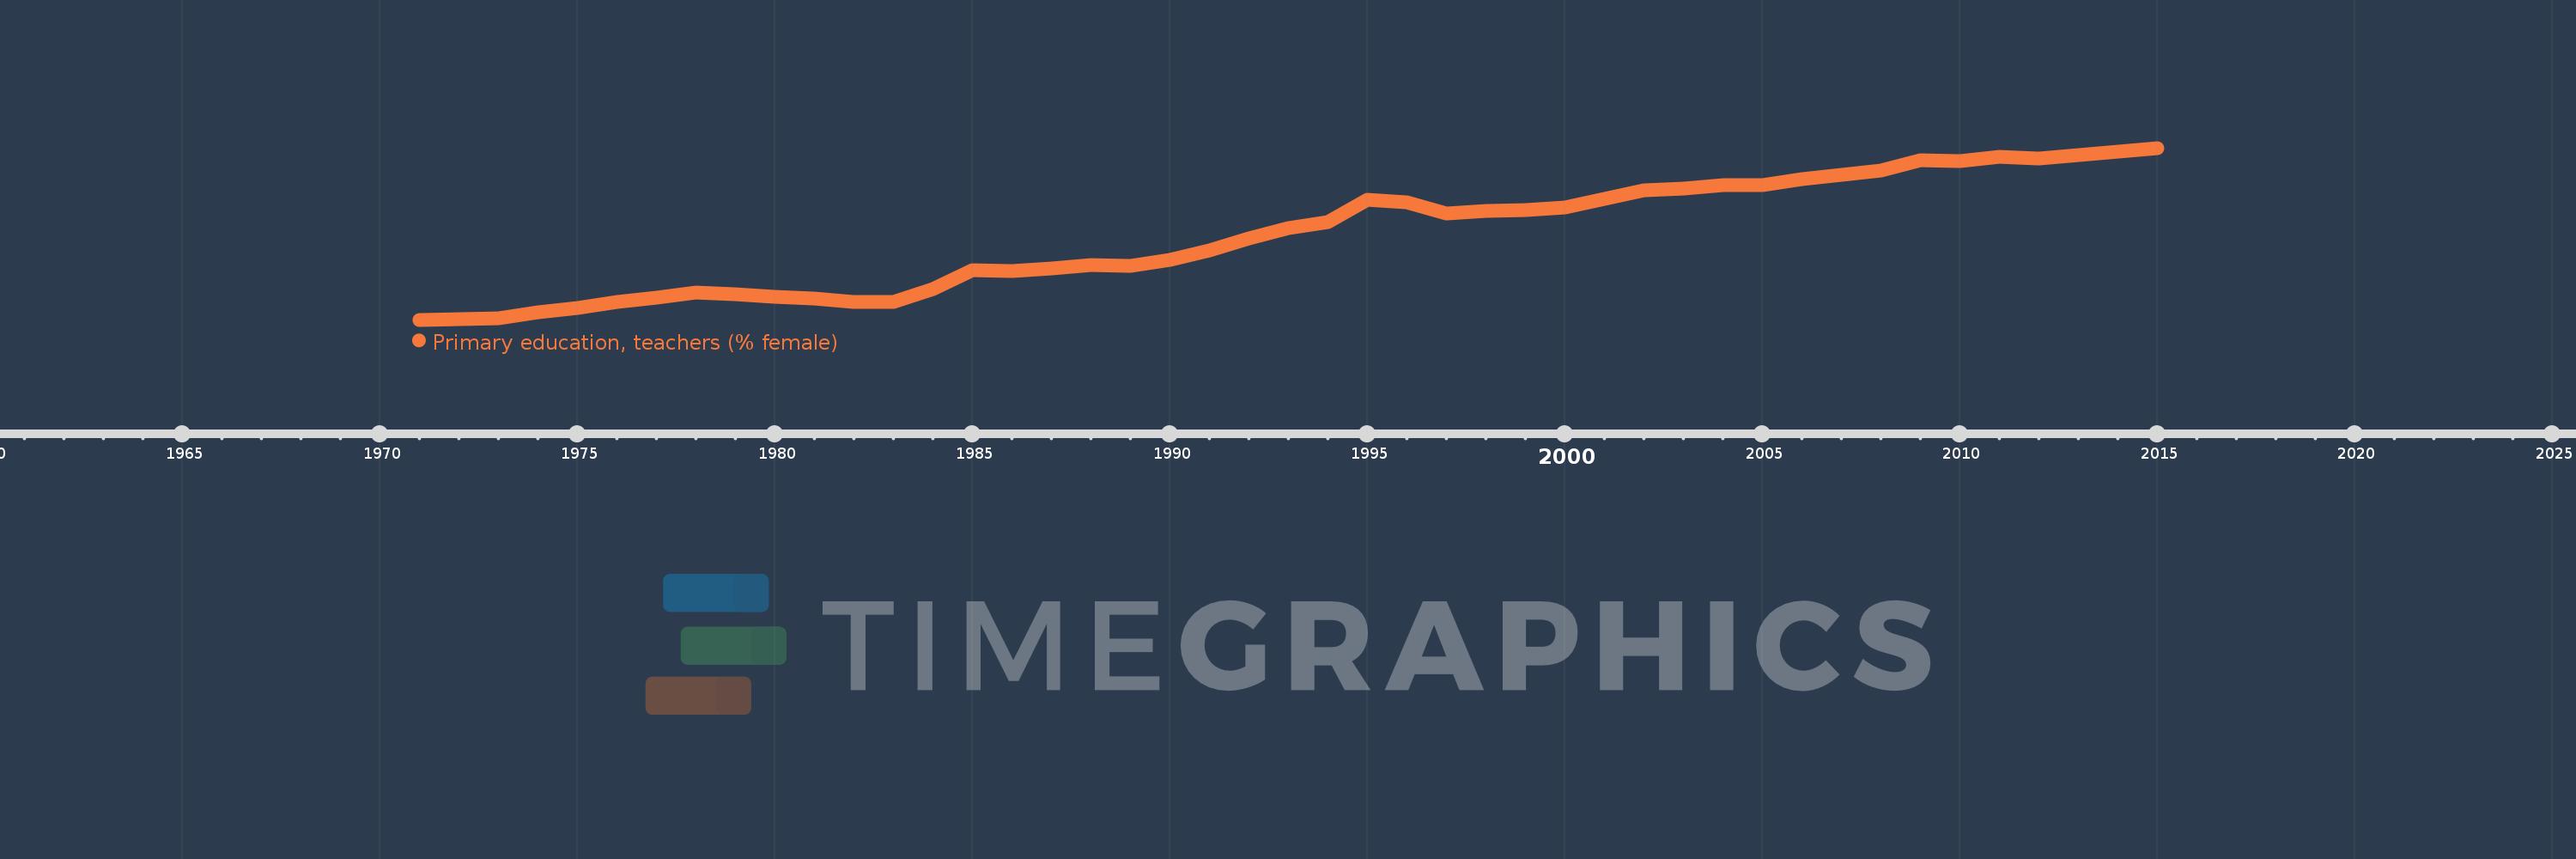
Primary education, teachers (% female)
2015,2014,2013,2012,2011,2010,2009,2008,2007,2006,2005,2004,2003,2002,2001,2000,1999,1998,1997,1996,1995,1994,1993,1992,1991,1990,1989,1988,1987,1986,1985,1984,1983,1982,1981,1980,1979,1978,1977,1976,1975,1974,1973,1972,1971
Queste statistiche in altri paesi:
AfghanistanAlbaniaAlgeriaAndorraAngolaAntigua and BarbudaArab WorldArgentinaArmeniaArubaAustraliaAustriaAzerbaijanBahamas, TheBahrainBangladeshBarbadosBelarusBelgiumBelizeBeninBermudaBhutanBoliviaBosnia and HerzegovinaBotswanaBrazilBritish Virgin IslandsBrunei DarussalamBulgariaBurkina FasoBurundiCabo VerdeCambodiaCameroonCanadaCaribbean small statesCayman IslandsCentral African RepublicCentral Europe and the BalticsChadChileChinaColombiaComorosCongo, Dem. Rep.Congo, Rep.Costa RicaCote d'IvoireCroatiaCubaCyprusCzech RepublicDenmarkDjiboutiDominicaDominican RepublicEarly-demographic dividendEast Asia & PacificEast Asia & Pacific (excluding high income)East Asia & Pacific (IDA & IBRD countries)EcuadorEgypt, Arab Rep.El SalvadorEquatorial GuineaEritreaEstoniaEthiopiaEuro areaEurope & Central AsiaEurope & Central Asia (excluding high income)Europe & Central Asia (IDA & IBRD countries)European UnionFijiFinlandFragile and conflict affected situationsFranceGabonGambia, TheGeorgiaGermanyGhanaGibraltarGreeceGrenadaGuatemalaGuineaGuinea-BissauGuyanaHaitiHeavily indebted poor countries (HIPC)High incomeHondurasHong Kong SAR, ChinaHungaryIBRD onlyIcelandIDA & IBRD totalIDA blendIDA onlyIDA totalIndiaIndonesiaIran, Islamic Rep.IraqIrelandIsraelItalyJamaicaJapanJordanKazakhstanKenyaKiribatiKorea, Dem. People’s Rep.Korea, Rep.KuwaitKyrgyz RepublicLao PDRLate-demographic dividendLatin America & Caribbean Latin America & Caribbean (excluding high income)Latin America & the Caribbean (IDA & IBRD countries)LatviaLeast developed countries: UN classificationLebanonLesothoLiberiaLibyaLiechtensteinLithuaniaLow & middle incomeLow incomeLower middle incomeLuxembourgMacao SAR, ChinaMacedonia, FYRMadagascarMalawiMalaysiaMaldivesMaliMaltaMarshall IslandsMauritaniaMauritiusMexicoMiddle East & North AfricaMiddle East & North Africa (excluding high income)Middle East & North Africa (IDA & IBRD countries)Middle incomeMoldovaMonacoMongoliaMoroccoMozambiqueMyanmarNamibiaNauruNepalNetherlandsNew ZealandNicaraguaNigerNigeriaNorth AmericaNorwayOECD membersOmanOther small statesPacific island small statesPakistanPalauPanamaPapua New GuineaParaguayPeruPhilippinesPolandPortugalPost-demographic dividendPre-demographic dividendPuerto RicoQatarRomaniaRussian FederationRwandaSamoaSan MarinoSao Tome and PrincipeSaudi ArabiaSenegalSerbiaSeychellesSierra LeoneSingaporeSint Maarten (Dutch part)Slovak RepublicSloveniaSmall statesSolomon IslandsSomaliaSouth AfricaSouth AsiaSouth Asia (IDA & IBRD)South SudanSpainSri LankaSt. Kitts and NevisSt. LuciaSt. Vincent and the GrenadinesSub-Saharan Africa Sub-Saharan Africa (excluding high income)Sub-Saharan Africa (IDA & IBRD countries)SudanSurinameSwazilandSwedenSwitzerlandSyrian Arab RepublicTajikistanTanzaniaThailandTimor-LesteTogoTongaTrinidad and TobagoTunisiaTurkeyTurks and Caicos IslandsTuvaluUgandaUkraineUnited Arab EmiratesUnited KingdomUnited StatesUpper middle incomeUruguayUzbekistanVanuatuVenezuela, RBVietnamWest Bank and GazaWorldYemen, Rep.ZambiaZimbabwe Linea del tempo:
Questa scala temporale mostra un grafico dal 1971 anno al 2015 anno. Euro area. I dati fino ad 1970 anno non disponibili. Il numero di osservazioni attuali secondo i date: 45.
La fonte (nome):
Indicatori dello sviluppo mondiale
La fonte (organizzazione):
United Nations Educational, Scientific, and Cultural Organization (UNESCO) Institute for Statistics.
Categorie:
Education, Gender
sono stati aggiornati
23 apr 2017 anni
Indicatori delle variazioni dei valori per anni
Minima:
72.482
1 gen 1971 anni
Massimo:
84.572
1 gen 2015 anni
Alla data di osservazione
Valore
Variazione assoluta
La variazione rispetto al valore precedente
1 gen 1971 anni
72.482
+72.482
0.0%
1 gen 1972 anni
72.532
+0.05
0.07%
1 gen 1973 anni
72.592
+0.06
0.08%
1 gen 1974 anni
73.003
+0.412
0.57%
1 gen 1975 anni
73.334
+0.331
0.45%
1 gen 1976 anni
73.741
+0.407
0.56%
1 gen 1977 anni
74.063
+0.322
0.44%
1 gen 1978 anni
74.392
+0.329
0.44%
1 gen 1979 anni
74.307
-0.085
-0.11%
1 gen 1980 anni
74.067
-0.24
-0.32%
1 gen 1981 anni
73.991
-0.075
-0.1%
1 gen 1982 anni
73.723
-0.268
-0.36%
1 gen 1983 anni
73.719
-0.005
-0.01%
1 gen 1984 anni
74.669
+0.951
1.29%
1 gen 1985 anni
75.944
+1.275
1.71%
1 gen 1986 anni
75.901
-0.043
-0.06%
1 gen 1987 anni
76.11
+0.209
0.28%
1 gen 1988 anni
76.311
+0.201
0.26%
1 gen 1989 anni
76.278
-0.033
-0.04%
1 gen 1990 anni
76.721
+0.443
0.58%
1 gen 1991 anni
77.39
+0.669
0.87%
1 gen 1992 anni
78.187
+0.797
1.03%
1 gen 1993 anni
78.94
+0.753
0.96%
1 gen 1994 anni
79.384
+0.444
0.56%
1 gen 1995 anni
80.918
+1.533
1.93%
1 gen 1996 anni
80.723
-0.195
-0.24%
1 gen 1997 anni
79.981
-0.742
-0.92%
1 gen 1998 anni
80.118
+0.137
0.17%
1 gen 1999 anni
80.208
+0.09
0.11%
1 gen 2000 anni
80.395
+0.187
0.23%
1 gen 2001 anni
81.002
+0.607
0.76%
1 gen 2002 anni
81.581
+0.579
0.72%
1 gen 2003 anni
81.714
+0.133
0.16%
1 gen 2004 anni
81.929
+0.215
0.26%
1 gen 2005 anni
81.978
+0.049
0.06%
1 gen 2006 anni
82.365
+0.387
0.47%
1 gen 2007 anni
82.694
+0.329
0.4%
1 gen 2008 anni
83.011
+0.316
0.38%
1 gen 2009 anni
83.712
+0.702
0.85%
1 gen 2010 anni
83.637
-0.076
-0.09%
1 gen 2011 anni
83.926
+0.289
0.35%
1 gen 2012 anni
83.858
-0.068
-0.08%
1 gen 2013 anni
84.094
+0.237
0.28%
1 gen 2014 anni
84.289
+0.195
0.23%
1 gen 2015 anni
84.572
+0.283
0.34%
Classificazione dei paesi secondo i statistiche attuali per anni


Commenti: