29
/it/
it
AIzaSyAYiBZKx7MnpbEhh9jyipgxe19OcubqV5w
April 1, 2024
94724
Burkina Faso
BFA
true
2
1
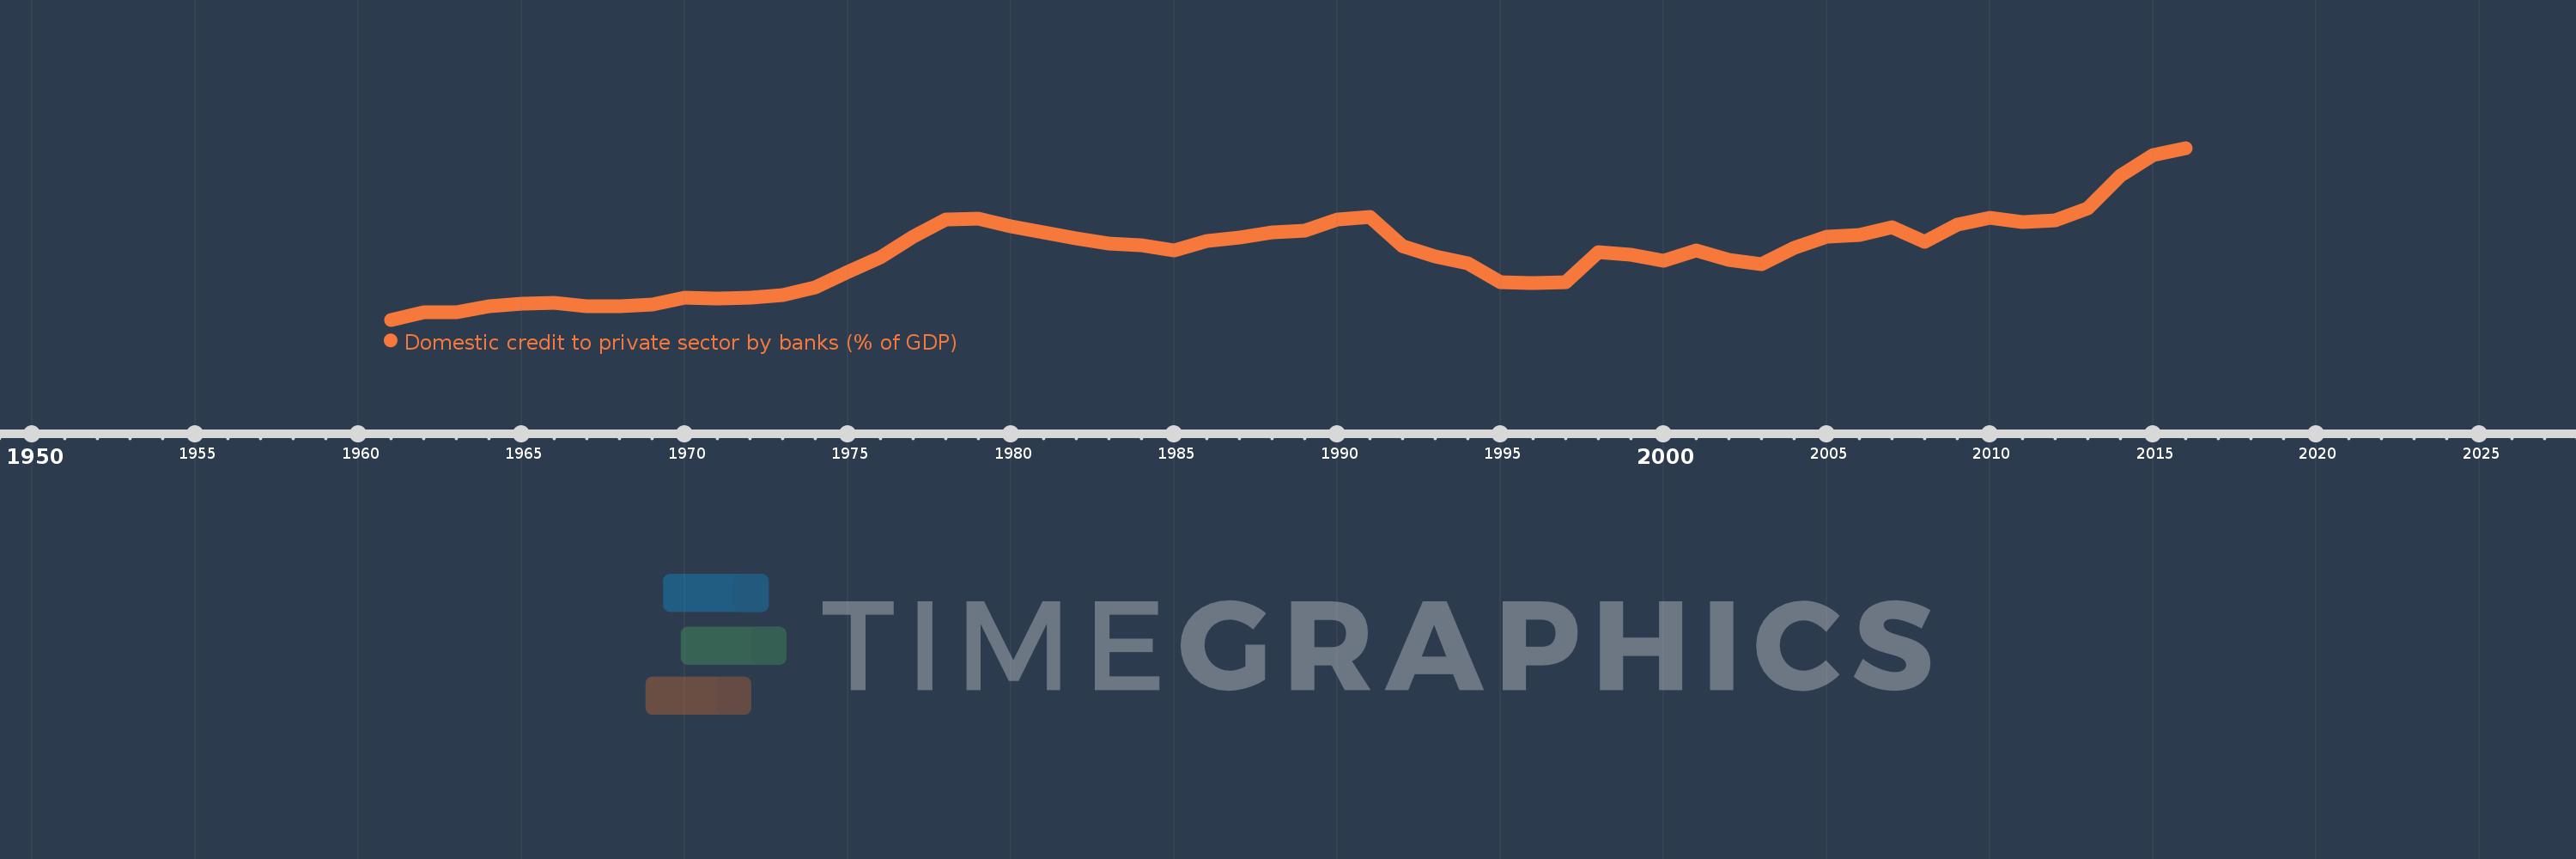
Domestic credit to private sector by banks (% of GDP)
2016,2015,2014,2013,2012,2011,2010,2009,2008,2007,2006,2005,2004,2003,2002,2001,2000,1999,1998,1997,1996,1995,1994,1993,1992,1991,1990,1989,1988,1987,1986,1985,1984,1983,1982,1981,1980,1979,1978,1977,1976,1975,1974,1973,1972,1971,1970,1969,1968,1967,1966,1965,1964,1963,1962,1961
Queste statistiche in altri paesi:
AfghanistanAlbaniaAlgeriaAngolaAntigua and BarbudaArab WorldArgentinaArmeniaArubaAustraliaAustriaAzerbaijanBahamas, TheBahrainBangladeshBarbadosBelarusBelgiumBelizeBeninBhutanBoliviaBosnia and HerzegovinaBotswanaBrazilBrunei DarussalamBulgariaBurkina FasoBurundiCabo VerdeCambodiaCameroonCanadaCaribbean small statesCentral African RepublicCentral Europe and the BalticsChadChileChinaColombiaComorosCongo, Dem. Rep.Congo, Rep.Costa RicaCote d'IvoireCroatiaCyprusCzech RepublicDenmarkDjiboutiDominicaDominican RepublicEarly-demographic dividendEast Asia & PacificEast Asia & Pacific (excluding high income)East Asia & Pacific (IDA & IBRD countries)EcuadorEgypt, Arab Rep.El SalvadorEquatorial GuineaEritreaEstoniaEthiopiaEuro areaEurope & Central AsiaEurope & Central Asia (excluding high income)Europe & Central Asia (IDA & IBRD countries)European UnionFijiFinlandFragile and conflict affected situationsFranceGabonGambia, TheGeorgiaGermanyGhanaGreeceGrenadaGuatemalaGuineaGuinea-BissauGuyanaHaitiHeavily indebted poor countries (HIPC)High incomeHondurasHong Kong SAR, ChinaHungaryIBRD onlyIcelandIDA & IBRD totalIDA blendIDA onlyIDA totalIndiaIndonesiaIran, Islamic Rep.IraqIrelandIsraelItalyJamaicaJapanJordanKazakhstanKenyaKorea, Rep.KosovoKuwaitKyrgyz RepublicLao PDRLate-demographic dividendLatin America & Caribbean Latin America & Caribbean (excluding high income)Latin America & the Caribbean (IDA & IBRD countries)LatviaLeast developed countries: UN classificationLebanonLesothoLiberiaLibyaLithuaniaLow & middle incomeLow incomeLower middle incomeLuxembourgMacao SAR, ChinaMacedonia, FYRMadagascarMalawiMalaysiaMaldivesMaliMaltaMauritaniaMauritiusMexicoMicronesia, Fed. Sts.Middle East & North AfricaMiddle East & North Africa (excluding high income)Middle East & North Africa (IDA & IBRD countries)Middle incomeMoldovaMongoliaMontenegroMoroccoMozambiqueMyanmarNamibiaNepalNetherlandsNew ZealandNicaraguaNigerNigeriaNorth AmericaNorwayOECD membersOmanOther small statesPacific island small statesPakistanPanamaPapua New GuineaParaguayPeruPhilippinesPolandPortugalPost-demographic dividendPre-demographic dividendQatarRomaniaRussian FederationRwandaSamoaSao Tome and PrincipeSaudi ArabiaSenegalSerbiaSeychellesSierra LeoneSingaporeSlovak RepublicSloveniaSmall statesSolomon IslandsSouth AfricaSouth AsiaSouth Asia (IDA & IBRD)South SudanSpainSri LankaSt. Kitts and NevisSt. LuciaSt. Vincent and the GrenadinesSub-Saharan Africa Sub-Saharan Africa (excluding high income)Sub-Saharan Africa (IDA & IBRD countries)SudanSurinameSwazilandSwedenSwitzerlandSyrian Arab RepublicTajikistanTanzaniaThailandTimor-LesteTogoTongaTrinidad and TobagoTunisiaTurkeyUgandaUkraineUnited Arab EmiratesUnited KingdomUnited StatesUpper middle incomeUruguayVanuatuVenezuela, RBVietnamWest Bank and GazaWorldYemen, Rep.ZambiaZimbabwe Linea del tempo:
Questa scala temporale mostra un grafico dal 1961 anno al 2016 anno. Burkina Faso. I dati fino ad 1960 anno non disponibili. Il numero di osservazioni attuali secondo i date: 56.
La fonte (nome):
Indicatori dello sviluppo mondiale
La fonte (organizzazione):
International Monetary Fund, International Financial Statistics and data files, and World Bank and OECD GDP estimates.
Categorie:
Financial Sector
sono stati aggiornati
23 apr 2017 anni
Indicatori delle variazioni dei valori per anni
Minima:
1.135
1 gen 1961 anni
Massimo:
27.17
1 gen 2016 anni
Alla data di osservazione
Valore
Variazione assoluta
La variazione rispetto al valore precedente
1 gen 1961 anni
1.135
+1.135
0.0%
1 gen 1962 anni
2.223
+1.088
95.82%
1 gen 1963 anni
2.301
+0.078
3.49%
1 gen 1964 anni
3.128
+0.827
35.94%
1 gen 1965 anni
3.591
+0.463
14.79%
1 gen 1966 anni
3.715
+0.124
3.46%
1 gen 1967 anni
3.152
-0.563
-15.15%
1 gen 1968 anni
3.183
+0.031
1.0%
1 gen 1969 anni
3.438
+0.255
8.0%
1 gen 1970 anni
4.487
+1.049
30.51%
1 gen 1971 anni
4.35
-0.137
-3.05%
1 gen 1972 anni
4.494
+0.144
3.31%
1 gen 1973 anni
4.897
+0.403
8.96%
1 gen 1974 anni
5.989
+1.092
22.29%
1 gen 1975 anni
8.384
+2.395
39.99%
1 gen 1976 anni
10.606
+2.222
26.5%
1 gen 1977 anni
13.69
+3.084
29.08%
1 gen 1978 anni
16.291
+2.601
19.0%
1 gen 1979 anni
16.466
+0.176
1.08%
1 gen 1980 anni
15.233
-1.234
-7.49%
1 gen 1981 anni
14.393
-0.839
-5.51%
1 gen 1982 anni
13.462
-0.931
-6.47%
1 gen 1983 anni
12.729
-0.734
-5.45%
1 gen 1984 anni
12.481
-0.247
-1.94%
1 gen 1985 anni
11.666
-0.816
-6.54%
1 gen 1986 anni
13.068
+1.403
12.02%
1 gen 1987 anni
13.637
+0.569
4.36%
1 gen 1988 anni
14.329
+0.691
5.07%
1 gen 1989 anni
14.696
+0.367
2.56%
1 gen 1990 anni
16.294
+1.598
10.87%
1 gen 1991 anni
16.75
+0.456
2.8%
1 gen 1992 anni
12.257
-4.493
-26.82%
1 gen 1993 anni
10.677
-1.58
-12.89%
1 gen 1994 anni
9.674
-1.003
-9.39%
1 gen 1995 anni
6.868
-2.806
-29.01%
1 gen 1996 anni
6.649
-0.219
-3.18%
1 gen 1997 anni
6.794
+0.145
2.18%
1 gen 1998 anni
11.424
+4.63
68.14%
1 gen 1999 anni
10.933
-0.491
-4.3%
1 gen 2000 anni
10.056
-0.877
-8.02%
1 gen 2001 anni
11.608
+1.552
15.43%
1 gen 2002 anni
10.253
-1.355
-11.68%
1 gen 2003 anni
9.547
-0.706
-6.89%
1 gen 2004 anni
12.065
+2.518
26.38%
1 gen 2005 anni
13.726
+1.662
13.77%
1 gen 2006 anni
14.042
+0.316
2.3%
1 gen 2007 anni
15.098
+1.056
7.52%
1 gen 2008 anni
12.905
-2.193
-14.52%
1 gen 2009 anni
15.571
+2.666
20.66%
1 gen 2010 anni
16.577
+1.006
6.46%
1 gen 2011 anni
15.933
-0.644
-3.88%
1 gen 2012 anni
16.216
+0.283
1.78%
1 gen 2013 anni
18.048
+1.832
11.3%
1 gen 2014 anni
23.015
+4.967
27.52%
1 gen 2015 anni
26.041
+3.026
13.15%
1 gen 2016 anni
27.17
+1.128
4.33%
Classificazione dei paesi secondo i statistiche attuali per anni


Commenti: