29
/it/
it
AIzaSyAYiBZKx7MnpbEhh9jyipgxe19OcubqV5w
April 1, 2024
53327
Other small states
OSS
false
2
1
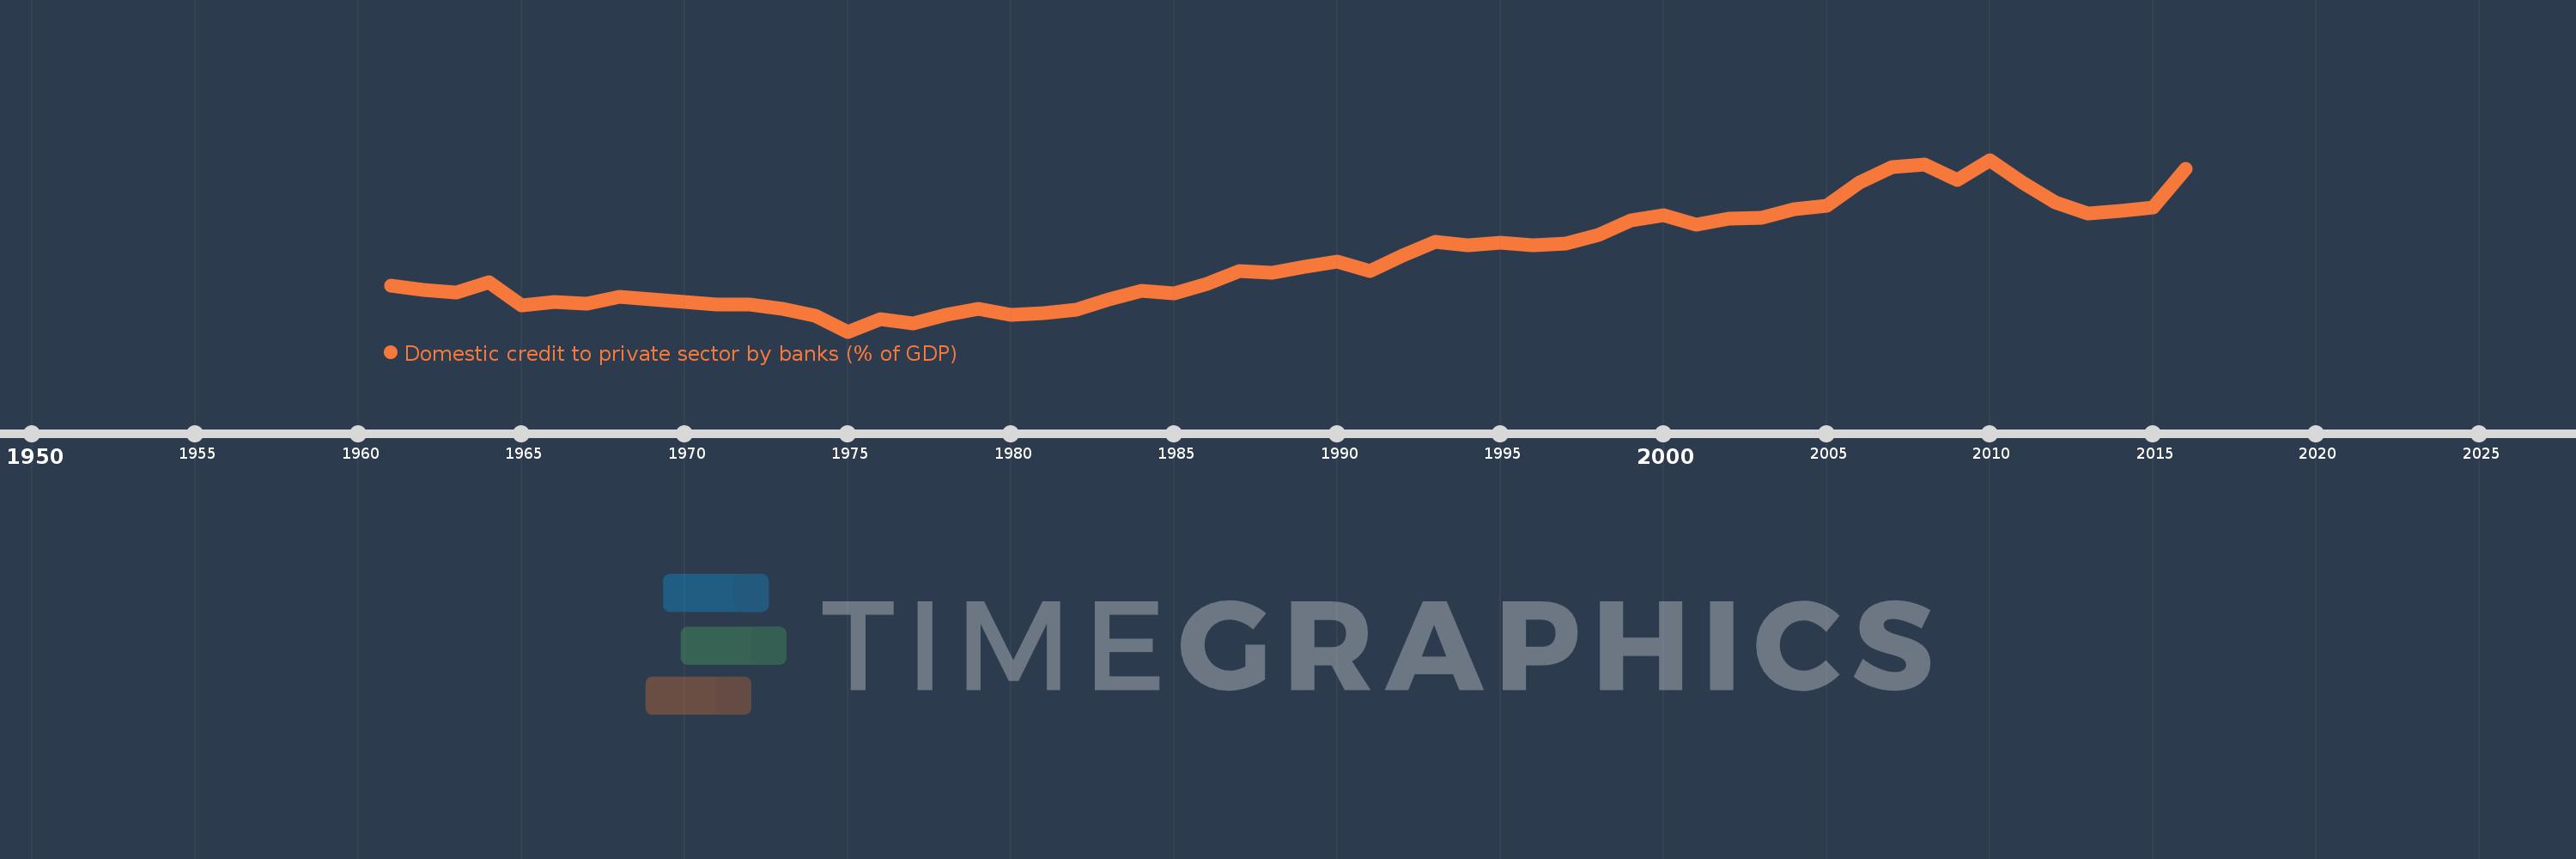
Domestic credit to private sector by banks (% of GDP)
2016,2015,2014,2013,2012,2011,2010,2009,2008,2007,2006,2005,2004,2003,2002,2001,2000,1999,1998,1997,1996,1995,1994,1993,1992,1991,1990,1989,1988,1987,1986,1985,1984,1983,1982,1981,1980,1979,1978,1977,1976,1975,1974,1973,1972,1971,1968,1967,1966,1965,1964,1963,1962,1961
Queste statistiche in altri paesi:
AfghanistanAlbaniaAlgeriaAngolaAntigua and BarbudaArab WorldArgentinaArmeniaArubaAustraliaAustriaAzerbaijanBahamas, TheBahrainBangladeshBarbadosBelarusBelgiumBelizeBeninBhutanBoliviaBosnia and HerzegovinaBotswanaBrazilBrunei DarussalamBulgariaBurkina FasoBurundiCabo VerdeCambodiaCameroonCanadaCaribbean small statesCentral African RepublicCentral Europe and the BalticsChadChileChinaColombiaComorosCongo, Dem. Rep.Congo, Rep.Costa RicaCote d'IvoireCroatiaCyprusCzech RepublicDenmarkDjiboutiDominicaDominican RepublicEarly-demographic dividendEast Asia & PacificEast Asia & Pacific (excluding high income)East Asia & Pacific (IDA & IBRD countries)EcuadorEgypt, Arab Rep.El SalvadorEquatorial GuineaEritreaEstoniaEthiopiaEuro areaEurope & Central AsiaEurope & Central Asia (excluding high income)Europe & Central Asia (IDA & IBRD countries)European UnionFijiFinlandFragile and conflict affected situationsFranceGabonGambia, TheGeorgiaGermanyGhanaGreeceGrenadaGuatemalaGuineaGuinea-BissauGuyanaHaitiHeavily indebted poor countries (HIPC)High incomeHondurasHong Kong SAR, ChinaHungaryIBRD onlyIcelandIDA & IBRD totalIDA blendIDA onlyIDA totalIndiaIndonesiaIran, Islamic Rep.IraqIrelandIsraelItalyJamaicaJapanJordanKazakhstanKenyaKorea, Rep.KosovoKuwaitKyrgyz RepublicLao PDRLate-demographic dividendLatin America & Caribbean Latin America & Caribbean (excluding high income)Latin America & the Caribbean (IDA & IBRD countries)LatviaLeast developed countries: UN classificationLebanonLesothoLiberiaLibyaLithuaniaLow & middle incomeLow incomeLower middle incomeLuxembourgMacao SAR, ChinaMacedonia, FYRMadagascarMalawiMalaysiaMaldivesMaliMaltaMauritaniaMauritiusMexicoMicronesia, Fed. Sts.Middle East & North AfricaMiddle East & North Africa (excluding high income)Middle East & North Africa (IDA & IBRD countries)Middle incomeMoldovaMongoliaMontenegroMoroccoMozambiqueMyanmarNamibiaNepalNetherlandsNew ZealandNicaraguaNigerNigeriaNorth AmericaNorwayOECD membersOmanOther small statesPacific island small statesPakistanPanamaPapua New GuineaParaguayPeruPhilippinesPolandPortugalPost-demographic dividendPre-demographic dividendQatarRomaniaRussian FederationRwandaSamoaSao Tome and PrincipeSaudi ArabiaSenegalSerbiaSeychellesSierra LeoneSingaporeSlovak RepublicSloveniaSmall statesSolomon IslandsSouth AfricaSouth AsiaSouth Asia (IDA & IBRD)South SudanSpainSri LankaSt. Kitts and NevisSt. LuciaSt. Vincent and the GrenadinesSub-Saharan Africa Sub-Saharan Africa (excluding high income)Sub-Saharan Africa (IDA & IBRD countries)SudanSurinameSwazilandSwedenSwitzerlandSyrian Arab RepublicTajikistanTanzaniaThailandTimor-LesteTogoTongaTrinidad and TobagoTunisiaTurkeyUgandaUkraineUnited Arab EmiratesUnited KingdomUnited StatesUpper middle incomeUruguayVanuatuVenezuela, RBVietnamWest Bank and GazaWorldYemen, Rep.ZambiaZimbabwe Linea del tempo:
Questa scala temporale mostra un grafico dal 1961 anno al 2016 anno. Other small states. I dati fino ad 1960 anno non disponibili. Il numero di osservazioni attuali secondo i date: 54.
La fonte (nome):
Indicatori dello sviluppo mondiale
La fonte (organizzazione):
International Monetary Fund, International Financial Statistics and data files, and World Bank and OECD GDP estimates.
Categorie:
Financial Sector
sono stati aggiornati
23 apr 2017 anni
Indicatori delle variazioni dei valori per anni
Minima:
17.032
1 gen 1975 anni
Massimo:
75.974
1 gen 2010 anni
Alla data di osservazione
Valore
Variazione assoluta
La variazione rispetto al valore precedente
1 gen 1961 anni
32.724
+32.724
0.0%
1 gen 1962 anni
31.183
-1.541
-4.71%
1 gen 1963 anni
30.435
-0.748
-2.4%
1 gen 1964 anni
34.056
+3.62
11.9%
1 gen 1965 anni
26.128
-7.928
-23.28%
1 gen 1966 anni
27.062
+0.935
3.58%
1 gen 1967 anni
26.493
-0.569
-2.1%
1 gen 1968 anni
28.907
+2.413
9.11%
1 gen 1971 anni
26.399
-2.508
-8.68%
1 gen 1972 anni
26.255
-0.144
-0.54%
1 gen 1973 anni
24.954
-1.301
-4.96%
1 gen 1974 anni
22.569
-2.385
-9.56%
1 gen 1975 anni
17.032
-5.537
-24.53%
1 gen 1976 anni
21.306
+4.274
25.09%
1 gen 1977 anni
19.857
-1.449
-6.8%
1 gen 1978 anni
22.878
+3.021
15.21%
1 gen 1979 anni
24.716
+1.838
8.04%
1 gen 1980 anni
22.743
-1.973
-7.98%
1 gen 1981 anni
23.362
+0.619
2.72%
1 gen 1982 anni
24.417
+1.055
4.52%
1 gen 1983 anni
27.983
+3.566
14.6%
1 gen 1984 anni
31.005
+3.022
10.8%
1 gen 1985 anni
30.229
-0.776
-2.5%
1 gen 1986 anni
33.459
+3.23
10.69%
1 gen 1987 anni
37.826
+4.366
13.05%
1 gen 1988 anni
37.313
-0.512
-1.35%
1 gen 1989 anni
39.173
+1.859
4.98%
1 gen 1990 anni
41.066
+1.893
4.83%
1 gen 1991 anni
37.816
-3.25
-7.91%
1 gen 1992 anni
43.199
+5.382
14.23%
1 gen 1993 anni
47.707
+4.508
10.44%
1 gen 1994 anni
46.563
-1.143
-2.4%
1 gen 1995 anni
47.546
+0.983
2.11%
1 gen 1996 anni
46.659
-0.887
-1.87%
1 gen 1997 anni
47.259
+0.6
1.29%
1 gen 1998 anni
50.303
+3.044
6.44%
1 gen 1999 anni
55.259
+4.956
9.85%
1 gen 2000 anni
57.066
+1.807
3.27%
1 gen 2001 anni
53.652
-3.413
-5.98%
1 gen 2002 anni
55.676
+2.024
3.77%
1 gen 2003 anni
56.169
+0.493
0.89%
1 gen 2004 anni
59.108
+2.938
5.23%
1 gen 2005 anni
60.085
+0.977
1.65%
1 gen 2006 anni
68.203
+8.118
13.51%
1 gen 2007 anni
73.362
+5.159
7.56%
1 gen 2008 anni
74.496
+1.134
1.55%
1 gen 2009 anni
69.101
-5.395
-7.24%
1 gen 2010 anni
75.974
+6.873
9.95%
1 gen 2011 anni
68.08
-7.894
-10.39%
1 gen 2012 anni
61.253
-6.827
-10.03%
1 gen 2013 anni
57.435
-3.818
-6.23%
1 gen 2014 anni
58.464
+1.028
1.79%
1 gen 2015 anni
59.683
+1.219
2.09%
1 gen 2016 anni
72.974
+13.291
22.27%
Classificazione dei paesi secondo i statistiche attuali per anni


Commenti: