29
/it/
it
AIzaSyAYiBZKx7MnpbEhh9jyipgxe19OcubqV5w
April 1, 2024
90995
Brazil
BRA
true
2
1
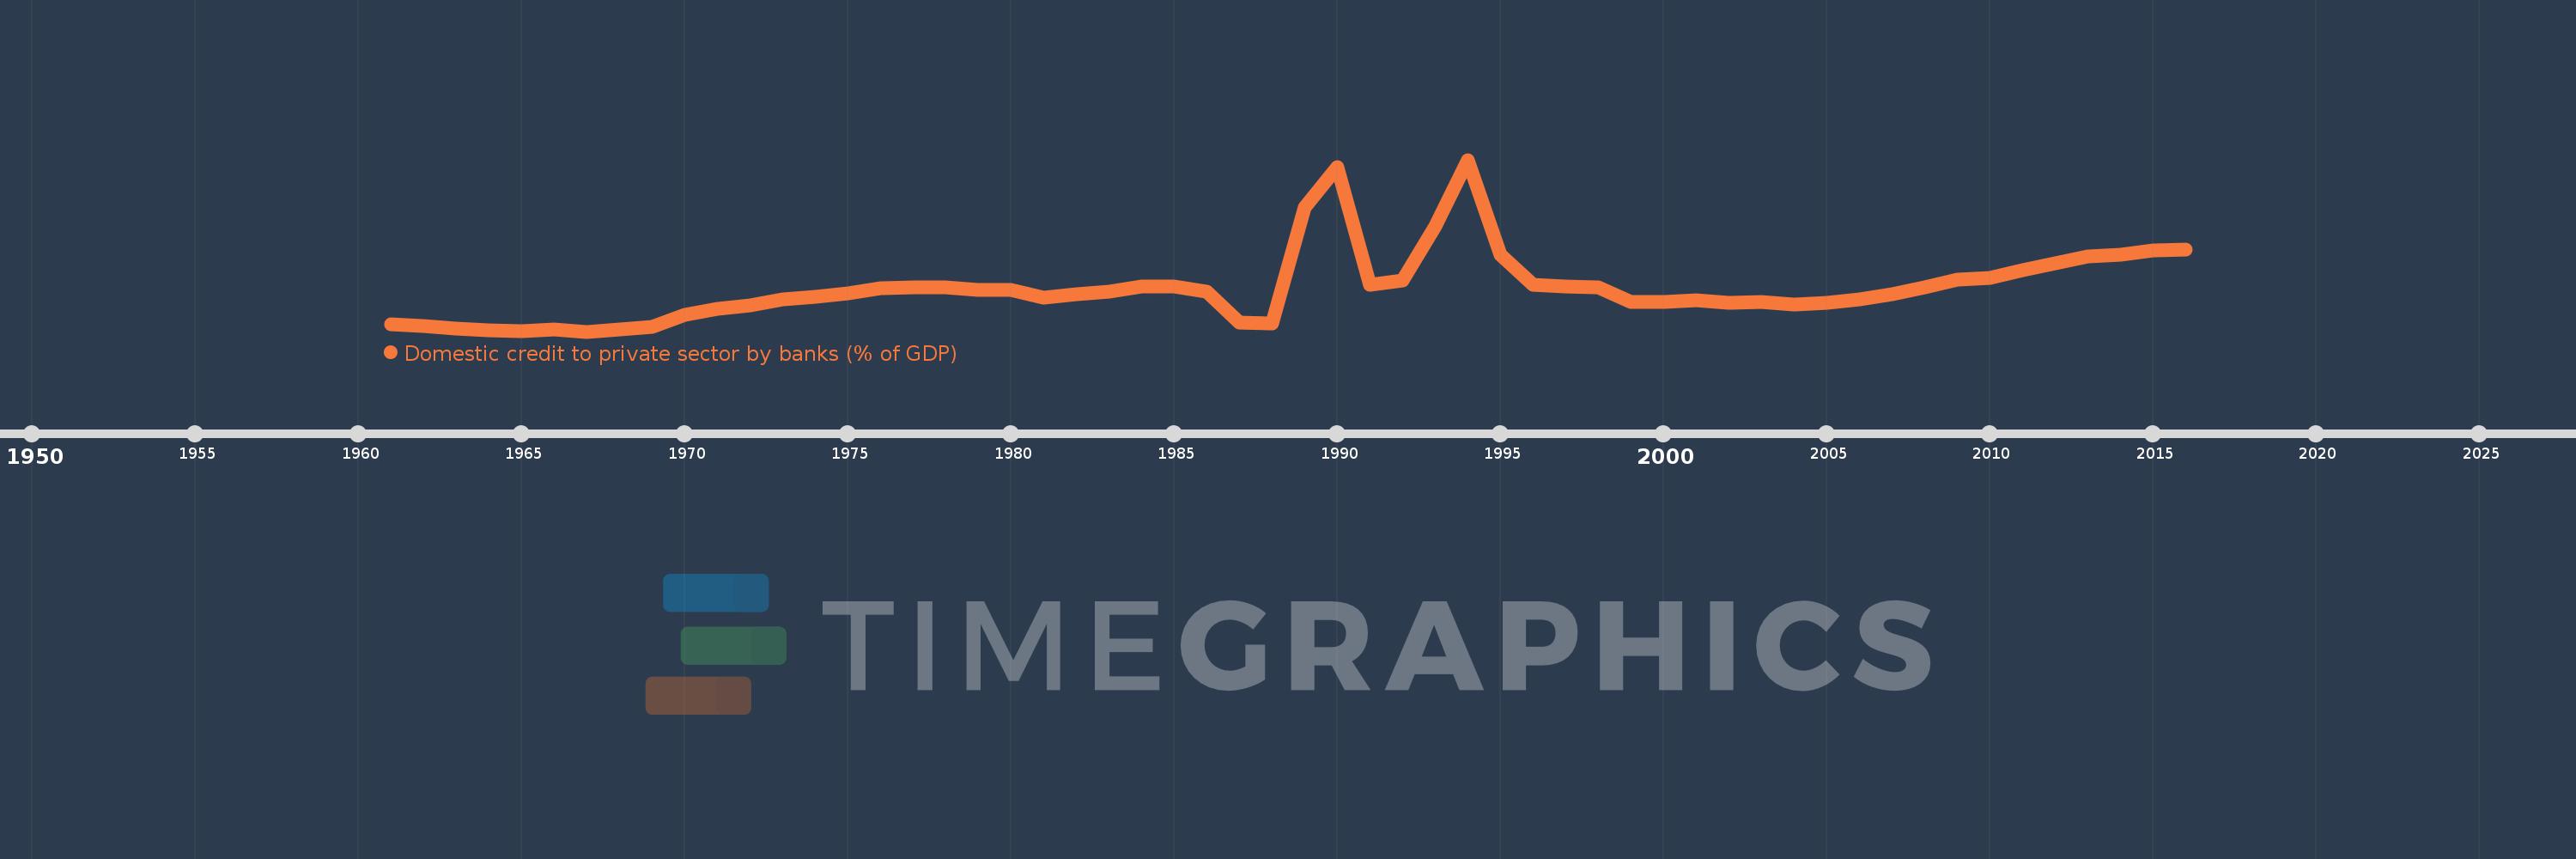
Domestic credit to private sector by banks (% of GDP)
2016,2015,2014,2013,2012,2011,2010,2009,2008,2007,2006,2005,2004,2003,2002,2001,2000,1999,1998,1997,1996,1995,1994,1993,1992,1991,1990,1989,1988,1987,1986,1985,1984,1983,1982,1981,1980,1979,1978,1977,1976,1975,1974,1973,1972,1971,1970,1969,1968,1967,1966,1965,1964,1963,1962,1961
Queste statistiche in altri paesi:
AfghanistanAlbaniaAlgeriaAngolaAntigua and BarbudaArab WorldArgentinaArmeniaArubaAustraliaAustriaAzerbaijanBahamas, TheBahrainBangladeshBarbadosBelarusBelgiumBelizeBeninBhutanBoliviaBosnia and HerzegovinaBotswanaBrazilBrunei DarussalamBulgariaBurkina FasoBurundiCabo VerdeCambodiaCameroonCanadaCaribbean small statesCentral African RepublicCentral Europe and the BalticsChadChileChinaColombiaComorosCongo, Dem. Rep.Congo, Rep.Costa RicaCote d'IvoireCroatiaCyprusCzech RepublicDenmarkDjiboutiDominicaDominican RepublicEarly-demographic dividendEast Asia & PacificEast Asia & Pacific (excluding high income)East Asia & Pacific (IDA & IBRD countries)EcuadorEgypt, Arab Rep.El SalvadorEquatorial GuineaEritreaEstoniaEthiopiaEuro areaEurope & Central AsiaEurope & Central Asia (excluding high income)Europe & Central Asia (IDA & IBRD countries)European UnionFijiFinlandFragile and conflict affected situationsFranceGabonGambia, TheGeorgiaGermanyGhanaGreeceGrenadaGuatemalaGuineaGuinea-BissauGuyanaHaitiHeavily indebted poor countries (HIPC)High incomeHondurasHong Kong SAR, ChinaHungaryIBRD onlyIcelandIDA & IBRD totalIDA blendIDA onlyIDA totalIndiaIndonesiaIran, Islamic Rep.IraqIrelandIsraelItalyJamaicaJapanJordanKazakhstanKenyaKorea, Rep.KosovoKuwaitKyrgyz RepublicLao PDRLate-demographic dividendLatin America & Caribbean Latin America & Caribbean (excluding high income)Latin America & the Caribbean (IDA & IBRD countries)LatviaLeast developed countries: UN classificationLebanonLesothoLiberiaLibyaLithuaniaLow & middle incomeLow incomeLower middle incomeLuxembourgMacao SAR, ChinaMacedonia, FYRMadagascarMalawiMalaysiaMaldivesMaliMaltaMauritaniaMauritiusMexicoMicronesia, Fed. Sts.Middle East & North AfricaMiddle East & North Africa (excluding high income)Middle East & North Africa (IDA & IBRD countries)Middle incomeMoldovaMongoliaMontenegroMoroccoMozambiqueMyanmarNamibiaNepalNetherlandsNew ZealandNicaraguaNigerNigeriaNorth AmericaNorwayOECD membersOmanOther small statesPacific island small statesPakistanPanamaPapua New GuineaParaguayPeruPhilippinesPolandPortugalPost-demographic dividendPre-demographic dividendQatarRomaniaRussian FederationRwandaSamoaSao Tome and PrincipeSaudi ArabiaSenegalSerbiaSeychellesSierra LeoneSingaporeSlovak RepublicSloveniaSmall statesSolomon IslandsSouth AfricaSouth AsiaSouth Asia (IDA & IBRD)South SudanSpainSri LankaSt. Kitts and NevisSt. LuciaSt. Vincent and the GrenadinesSub-Saharan Africa Sub-Saharan Africa (excluding high income)Sub-Saharan Africa (IDA & IBRD countries)SudanSurinameSwazilandSwedenSwitzerlandSyrian Arab RepublicTajikistanTanzaniaThailandTimor-LesteTogoTongaTrinidad and TobagoTunisiaTurkeyUgandaUkraineUnited Arab EmiratesUnited KingdomUnited StatesUpper middle incomeUruguayVanuatuVenezuela, RBVietnamWest Bank and GazaWorldYemen, Rep.ZambiaZimbabwe Linea del tempo:
Questa scala temporale mostra un grafico dal 1961 anno al 2016 anno. Brazil. I dati fino ad 1960 anno non disponibili. Il numero di osservazioni attuali secondo i date: 56.
La fonte (nome):
Indicatori dello sviluppo mondiale
La fonte (organizzazione):
International Monetary Fund, International Financial Statistics and data files, and World Bank and OECD GDP estimates.
Categorie:
Financial Sector
sono stati aggiornati
23 apr 2017 anni
Indicatori delle variazioni dei valori per anni
Minima:
8.302
1 gen 1967 anni
Massimo:
133.076
1 gen 1994 anni
Alla data di osservazione
Valore
Variazione assoluta
La variazione rispetto al valore precedente
1 gen 1961 anni
13.726
+13.726
0.0%
1 gen 1962 anni
12.477
-1.249
-9.1%
1 gen 1963 anni
10.231
-2.245
-18.0%
1 gen 1964 anni
9.317
-0.914
-8.94%
1 gen 1965 anni
8.547
-0.77
-8.27%
1 gen 1966 anni
9.669
+1.122
13.13%
1 gen 1967 anni
8.302
-1.367
-14.14%
1 gen 1968 anni
10.078
+1.775
21.38%
1 gen 1969 anni
11.535
+1.458
14.46%
1 gen 1970 anni
20.609
+9.074
78.66%
1 gen 1971 anni
24.625
+4.016
19.49%
1 gen 1972 anni
27.301
+2.676
10.87%
1 gen 1973 anni
31.682
+4.381
16.05%
1 gen 1974 anni
33.785
+2.103
6.64%
1 gen 1975 anni
35.878
+2.094
6.2%
1 gen 1976 anni
40.104
+4.226
11.78%
1 gen 1977 anni
40.154
+0.05
0.13%
1 gen 1978 anni
40.594
+0.44
1.09%
1 gen 1979 anni
38.63
-1.963
-4.84%
1 gen 1980 anni
38.703
+0.072
0.19%
1 gen 1981 anni
32.827
-5.875
-15.18%
1 gen 1982 anni
35.684
+2.857
8.7%
1 gen 1983 anni
37.156
+1.472
4.12%
1 gen 1984 anni
41.214
+4.058
10.92%
1 gen 1985 anni
41.221
+0.007
0.02%
1 gen 1986 anni
37.21
-4.011
-9.73%
1 gen 1987 anni
15.147
-22.063
-59.29%
1 gen 1988 anni
13.961
-1.186
-7.83%
1 gen 1989 anni
98.328
+84.366
604.29%
1 gen 1990 anni
127.736
+29.408
29.91%
1 gen 1991 anni
42.082
-85.653
-67.06%
1 gen 1992 anni
45.159
+3.077
7.31%
1 gen 1993 anni
84.466
+39.306
87.04%
1 gen 1994 anni
133.076
+48.61
57.55%
1 gen 1995 anni
64.144
-68.932
-51.8%
1 gen 1996 anni
42.142
-22.002
-34.3%
1 gen 1997 anni
40.778
-1.364
-3.24%
1 gen 1998 anni
40.741
-0.036
-0.09%
1 gen 1999 anni
29.532
-11.209
-27.51%
1 gen 2000 anni
29.827
+0.295
1.0%
1 gen 2001 anni
31.141
+1.314
4.41%
1 gen 2002 anni
29.004
-2.137
-6.86%
1 gen 2003 anni
29.645
+0.641
2.21%
1 gen 2004 anni
27.686
-1.959
-6.61%
1 gen 2005 anni
29.373
+1.687
6.09%
1 gen 2006 anni
31.84
+2.467
8.4%
1 gen 2007 anni
35.425
+3.585
11.26%
1 gen 2008 anni
40.691
+5.266
14.86%
1 gen 2009 anni
45.782
+5.091
12.51%
1 gen 2010 anni
47.494
+1.712
3.74%
1 gen 2011 anni
52.765
+5.27
11.1%
1 gen 2012 anni
58.115
+5.35
10.14%
1 gen 2013 anni
62.634
+4.52
7.78%
1 gen 2014 anni
64.414
+1.779
2.84%
1 gen 2015 anni
67.092
+2.679
4.16%
1 gen 2016 anni
67.865
+0.772
1.15%
Classificazione dei paesi secondo i statistiche attuali per anni


Commenti: