29
/it/
it
AIzaSyAYiBZKx7MnpbEhh9jyipgxe19OcubqV5w
April 1, 2024
141666
Greece
GRC
true
2
1
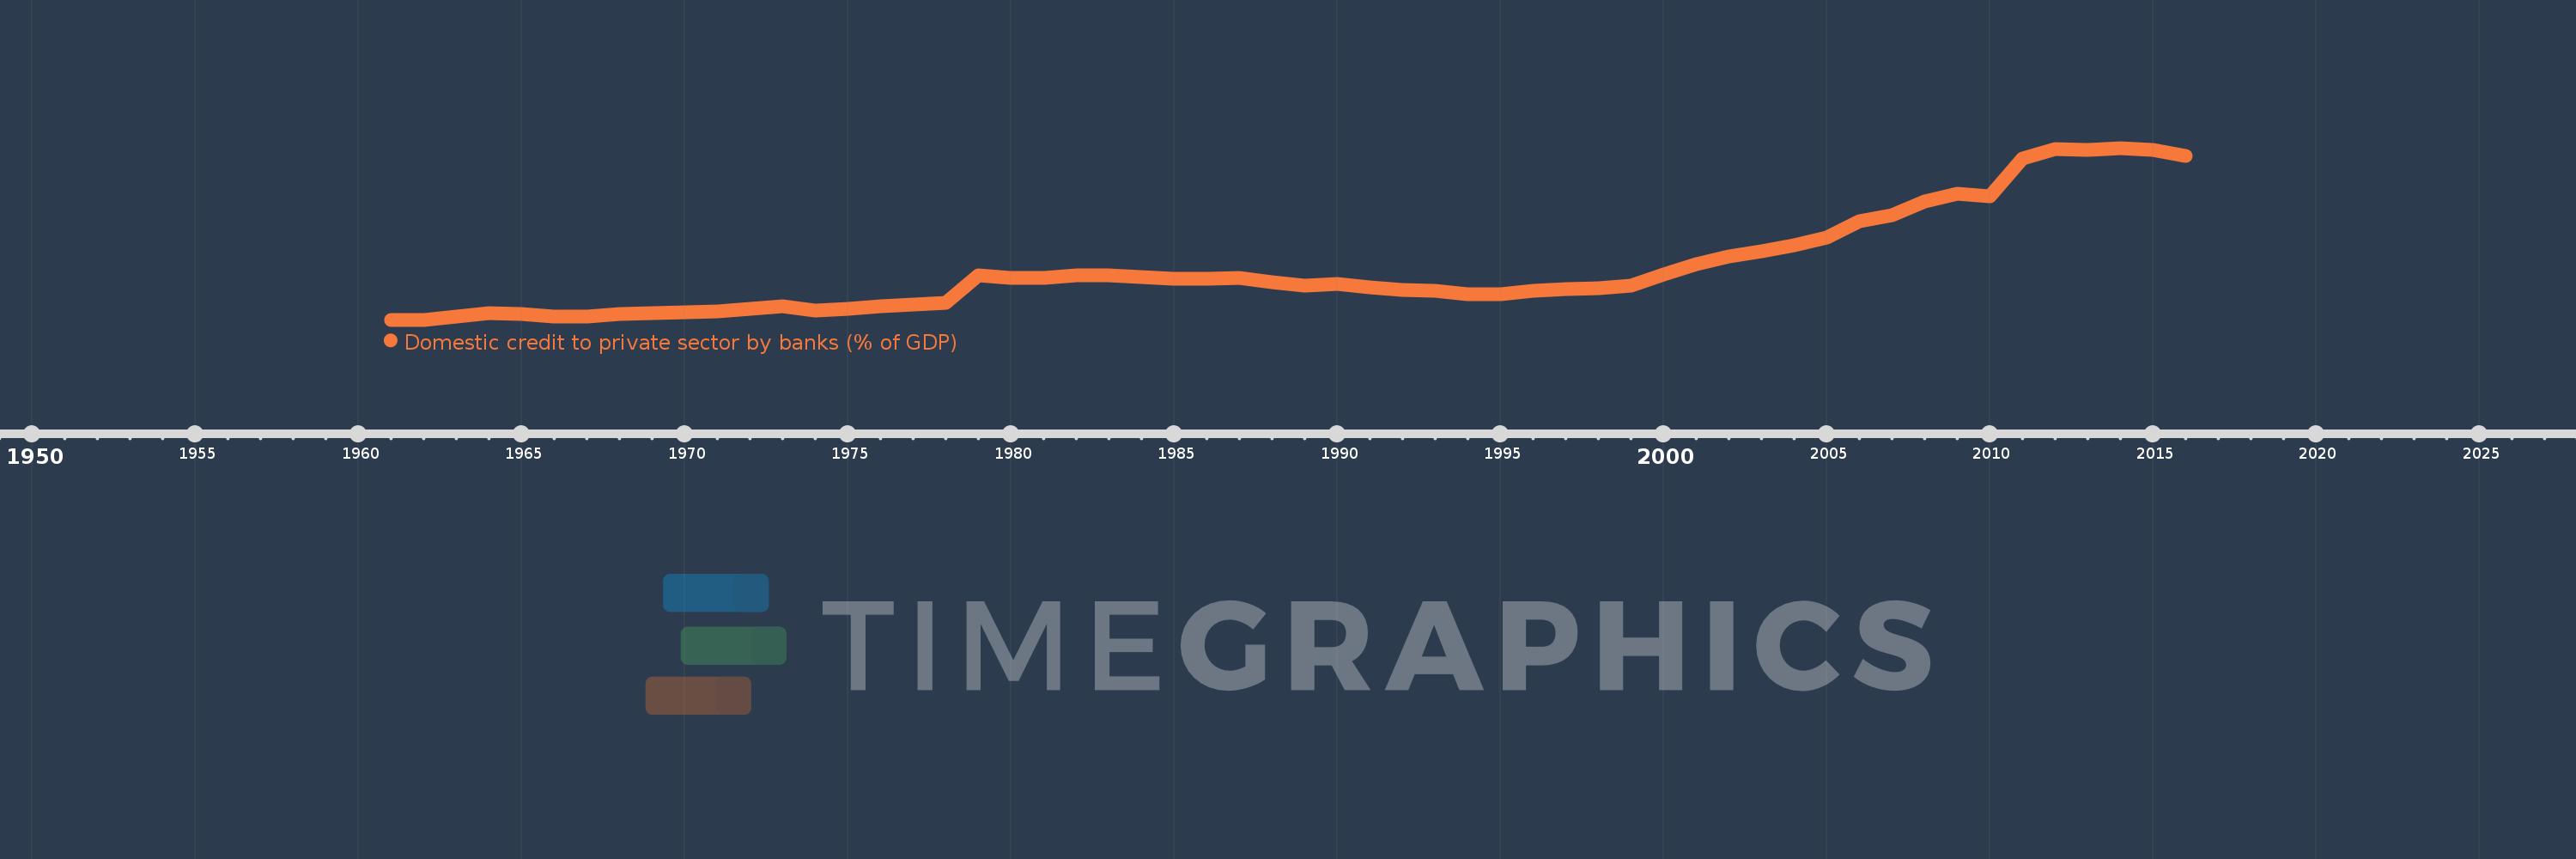
Domestic credit to private sector by banks (% of GDP)
2016,2015,2014,2013,2012,2011,2010,2009,2008,2007,2006,2005,2004,2003,2002,2001,2000,1999,1998,1997,1996,1995,1994,1993,1992,1991,1990,1989,1988,1987,1986,1985,1984,1983,1982,1981,1980,1979,1978,1977,1976,1975,1974,1973,1972,1971,1970,1969,1968,1967,1966,1965,1964,1963,1962,1961
Queste statistiche in altri paesi:
AfghanistanAlbaniaAlgeriaAngolaAntigua and BarbudaArab WorldArgentinaArmeniaArubaAustraliaAustriaAzerbaijanBahamas, TheBahrainBangladeshBarbadosBelarusBelgiumBelizeBeninBhutanBoliviaBosnia and HerzegovinaBotswanaBrazilBrunei DarussalamBulgariaBurkina FasoBurundiCabo VerdeCambodiaCameroonCanadaCaribbean small statesCentral African RepublicCentral Europe and the BalticsChadChileChinaColombiaComorosCongo, Dem. Rep.Congo, Rep.Costa RicaCote d'IvoireCroatiaCyprusCzech RepublicDenmarkDjiboutiDominicaDominican RepublicEarly-demographic dividendEast Asia & PacificEast Asia & Pacific (excluding high income)East Asia & Pacific (IDA & IBRD countries)EcuadorEgypt, Arab Rep.El SalvadorEquatorial GuineaEritreaEstoniaEthiopiaEuro areaEurope & Central AsiaEurope & Central Asia (excluding high income)Europe & Central Asia (IDA & IBRD countries)European UnionFijiFinlandFragile and conflict affected situationsFranceGabonGambia, TheGeorgiaGermanyGhanaGreeceGrenadaGuatemalaGuineaGuinea-BissauGuyanaHaitiHeavily indebted poor countries (HIPC)High incomeHondurasHong Kong SAR, ChinaHungaryIBRD onlyIcelandIDA & IBRD totalIDA blendIDA onlyIDA totalIndiaIndonesiaIran, Islamic Rep.IraqIrelandIsraelItalyJamaicaJapanJordanKazakhstanKenyaKorea, Rep.KosovoKuwaitKyrgyz RepublicLao PDRLate-demographic dividendLatin America & Caribbean Latin America & Caribbean (excluding high income)Latin America & the Caribbean (IDA & IBRD countries)LatviaLeast developed countries: UN classificationLebanonLesothoLiberiaLibyaLithuaniaLow & middle incomeLow incomeLower middle incomeLuxembourgMacao SAR, ChinaMacedonia, FYRMadagascarMalawiMalaysiaMaldivesMaliMaltaMauritaniaMauritiusMexicoMicronesia, Fed. Sts.Middle East & North AfricaMiddle East & North Africa (excluding high income)Middle East & North Africa (IDA & IBRD countries)Middle incomeMoldovaMongoliaMontenegroMoroccoMozambiqueMyanmarNamibiaNepalNetherlandsNew ZealandNicaraguaNigerNigeriaNorth AmericaNorwayOECD membersOmanOther small statesPacific island small statesPakistanPanamaPapua New GuineaParaguayPeruPhilippinesPolandPortugalPost-demographic dividendPre-demographic dividendQatarRomaniaRussian FederationRwandaSamoaSao Tome and PrincipeSaudi ArabiaSenegalSerbiaSeychellesSierra LeoneSingaporeSlovak RepublicSloveniaSmall statesSolomon IslandsSouth AfricaSouth AsiaSouth Asia (IDA & IBRD)South SudanSpainSri LankaSt. Kitts and NevisSt. LuciaSt. Vincent and the GrenadinesSub-Saharan Africa Sub-Saharan Africa (excluding high income)Sub-Saharan Africa (IDA & IBRD countries)SudanSurinameSwazilandSwedenSwitzerlandSyrian Arab RepublicTajikistanTanzaniaThailandTimor-LesteTogoTongaTrinidad and TobagoTunisiaTurkeyUgandaUkraineUnited Arab EmiratesUnited KingdomUnited StatesUpper middle incomeUruguayVanuatuVenezuela, RBVietnamWest Bank and GazaWorldYemen, Rep.ZambiaZimbabwe Linea del tempo:
Questa scala temporale mostra un grafico dal 1961 anno al 2016 anno. Greece. I dati fino ad 1960 anno non disponibili. Il numero di osservazioni attuali secondo i date: 56.
La fonte (nome):
Indicatori dello sviluppo mondiale
La fonte (organizzazione):
International Monetary Fund, International Financial Statistics and data files, and World Bank and OECD GDP estimates.
Categorie:
Financial Sector
sono stati aggiornati
23 apr 2017 anni
Indicatori delle variazioni dei valori per anni
Minima:
10.626
1 gen 1961 anni
Massimo:
117.883
1 gen 2014 anni
Alla data di osservazione
Valore
Variazione assoluta
La variazione rispetto al valore precedente
1 gen 1961 anni
10.626
+10.626
0.0%
1 gen 1962 anni
10.664
+0.039
0.37%
1 gen 1963 anni
12.592
+1.928
18.08%
1 gen 1964 anni
14.573
+1.98
15.73%
1 gen 1965 anni
14.179
-0.394
-2.71%
1 gen 1966 anni
12.65
-1.528
-10.78%
1 gen 1967 anni
12.784
+0.134
1.06%
1 gen 1968 anni
14.19
+1.406
11.0%
1 gen 1969 anni
14.889
+0.699
4.93%
1 gen 1970 anni
15.519
+0.63
4.23%
1 gen 1971 anni
15.856
+0.337
2.17%
1 gen 1972 anni
17.546
+1.691
10.66%
1 gen 1973 anni
19.089
+1.543
8.8%
1 gen 1974 anni
16.426
-2.664
-13.95%
1 gen 1975 anni
17.317
+0.892
5.43%
1 gen 1976 anni
18.999
+1.682
9.71%
1 gen 1977 anni
19.992
+0.993
5.23%
1 gen 1978 anni
21.39
+1.398
6.99%
1 gen 1979 anni
38.547
+17.157
80.21%
1 gen 1980 anni
36.685
-1.862
-4.83%
1 gen 1981 anni
36.702
+0.017
0.05%
1 gen 1982 anni
38.501
+1.8
4.9%
1 gen 1983 anni
38.162
-0.339
-0.88%
1 gen 1984 anni
37.317
-0.845
-2.21%
1 gen 1985 anni
36.398
-0.919
-2.46%
1 gen 1986 anni
36.149
-0.25
-0.69%
1 gen 1987 anni
36.503
+0.354
0.98%
1 gen 1988 anni
33.833
-2.67
-7.31%
1 gen 1989 anni
32.056
-1.777
-5.25%
1 gen 1990 anni
32.935
+0.88
2.74%
1 gen 1991 anni
31.084
-1.852
-5.62%
1 gen 1992 anni
29.319
-1.765
-5.68%
1 gen 1993 anni
28.69
-0.629
-2.14%
1 gen 1994 anni
26.638
-2.052
-7.15%
1 gen 1995 anni
26.624
-0.014
-0.05%
1 gen 1996 anni
28.832
+2.208
8.29%
1 gen 1997 anni
29.539
+0.708
2.45%
1 gen 1998 anni
30.449
+0.91
3.08%
1 gen 1999 anni
32.147
+1.698
5.58%
1 gen 2000 anni
38.9
+6.753
21.01%
1 gen 2001 anni
45.244
+6.344
16.31%
1 gen 2002 anni
49.976
+4.732
10.46%
1 gen 2003 anni
53.225
+3.25
6.5%
1 gen 2004 anni
57.033
+3.808
7.15%
1 gen 2005 anni
62.168
+5.135
9.0%
1 gen 2006 anni
71.872
+9.704
15.61%
1 gen 2007 anni
76.142
+4.27
5.94%
1 gen 2008 anni
84.404
+8.262
10.85%
1 gen 2009 anni
89.15
+4.746
5.62%
1 gen 2010 anni
87.868
-1.282
-1.44%
1 gen 2011 anni
111.431
+23.563
26.82%
1 gen 2012 anni
116.967
+5.536
4.97%
1 gen 2013 anni
116.61
-0.358
-0.31%
1 gen 2014 anni
117.883
+1.274
1.09%
1 gen 2015 anni
116.43
-1.453
-1.23%
1 gen 2016 anni
112.982
-3.448
-2.96%
Classificazione dei paesi secondo i statistiche attuali per anni


Commenti: