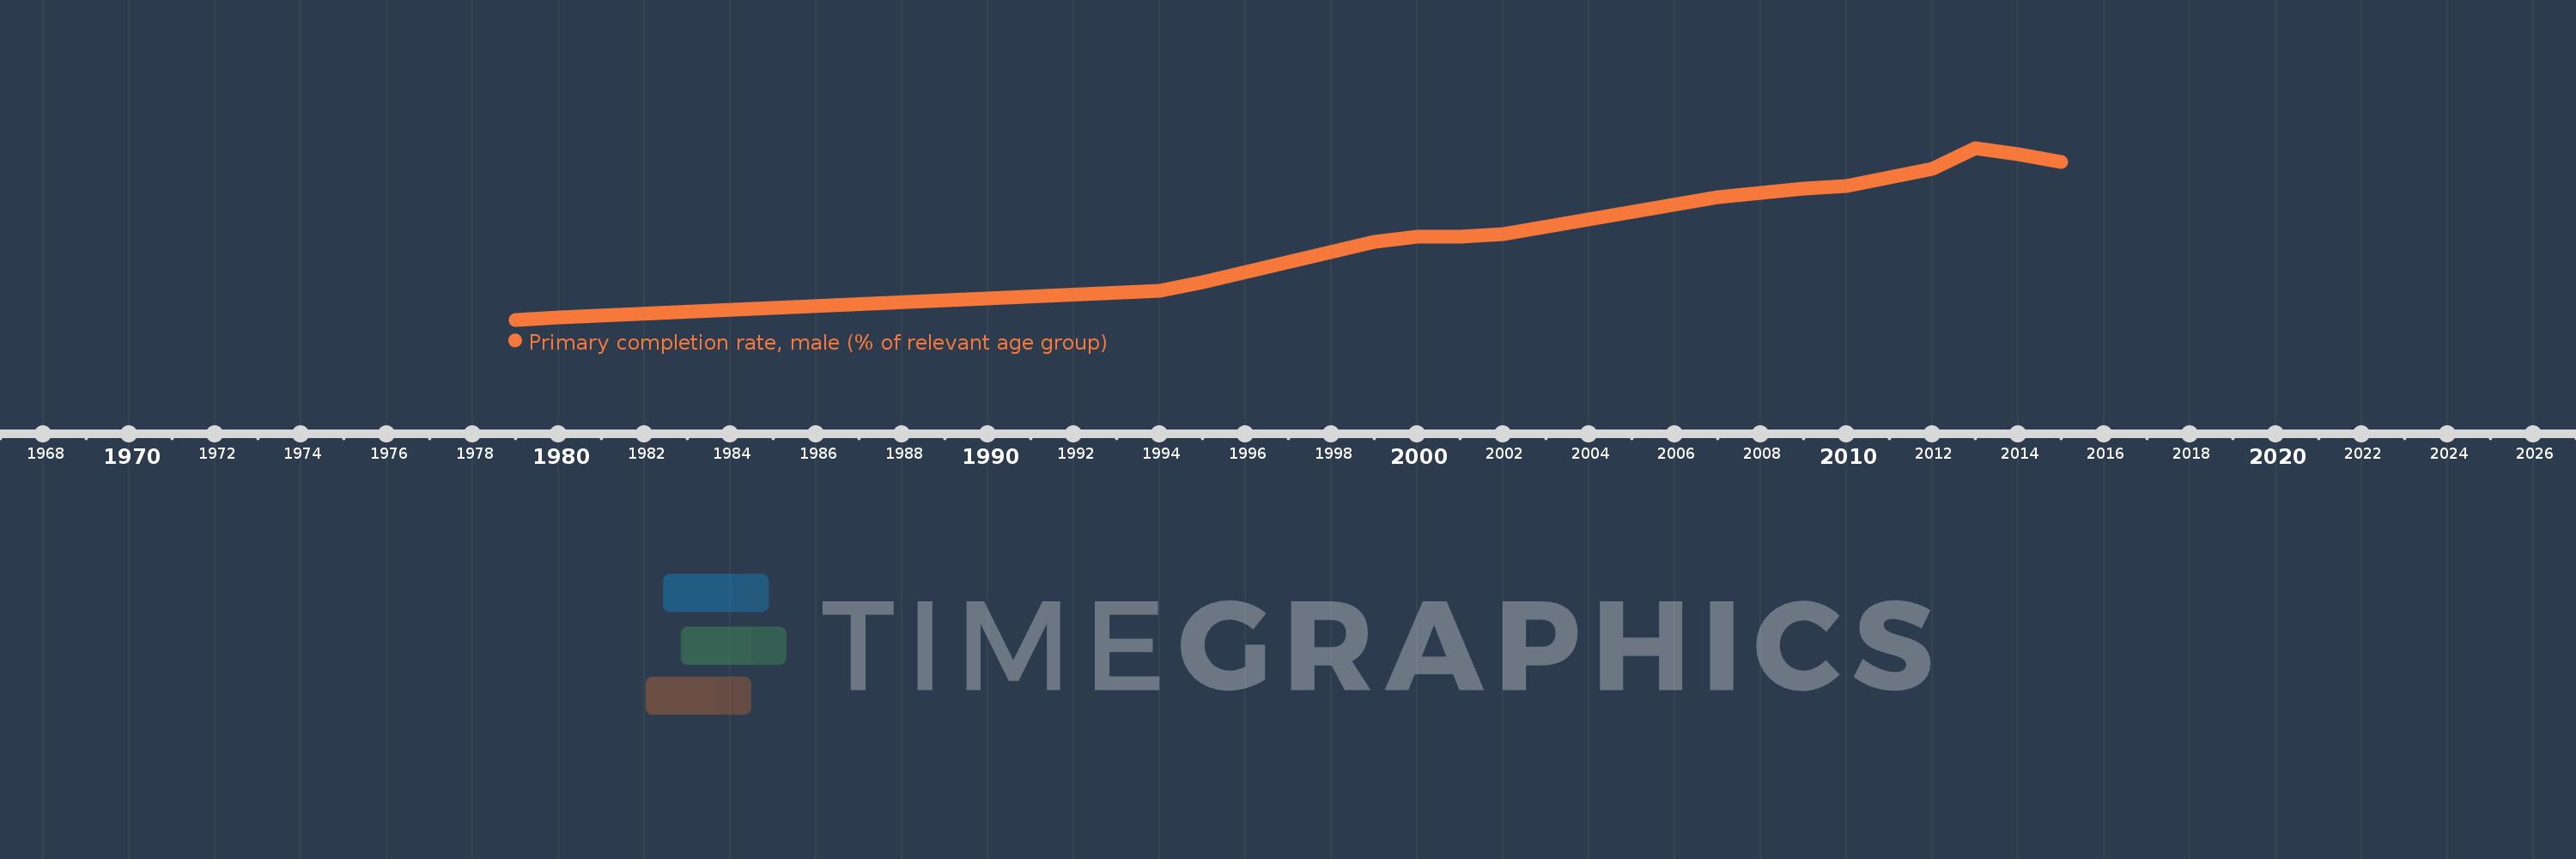
Questa scala temporale mostra un grafico dal 1979 anno al 2015 anno. Bhutan. I dati fino ad 1978 anno non disponibili. Il numero di osservazioni attuali secondo i date: 16.
La fonte (nome):
Indicatori dello sviluppo mondiale
La fonte (organizzazione):
United Nations Educational, Scientific, and Cultural Organization (UNESCO) Institute for Statistics.
Categorie:
Education, Gender
sono stati aggiornati
23 apr 2017 anni
Indicatori delle variazioni dei valori per anni
In media:
62.1
Minima:
13.38
1 gen 1979 anni
Massimo:
98.406
1 gen 2013 anni
Alla data di osservazione
Valore
Variazione assoluta
La variazione rispetto al valore precedente
1 gen 1979 anni
13.38
+13.38
0.0%
1 gen 1980 anni
14.622
+1.242
9.28%
1 gen 1994 anni
27.701
+13.08
89.45%
1 gen 1995 anni
31.874
+4.172
15.06%
1 gen 1999 anni
51.914
+20.04
62.87%
1 gen 2000 anni
54.583
+2.669
5.14%
1 gen 2001 anni
54.532
-0.051
-0.09%
1 gen 2002 anni
55.943
+1.411
2.59%
1 gen 2007 anni
74.061
+18.119
32.39%
1 gen 2009 anni
78.381
+4.32
5.83%
1 gen 2010 anni
79.611
+1.23
1.57%
1 gen 2011 anni
83.798
+4.187
5.26%
1 gen 2012 anni
87.901
+4.103
4.9%
1 gen 2013 anni
98.406
+10.505
11.95%
1 gen 2014 anni
95.485
-2.921
-2.97%
1 gen 2015 anni
91.413
-4.071
-4.26%
Classificazione dei paesi secondo i statistiche attuali per anni
