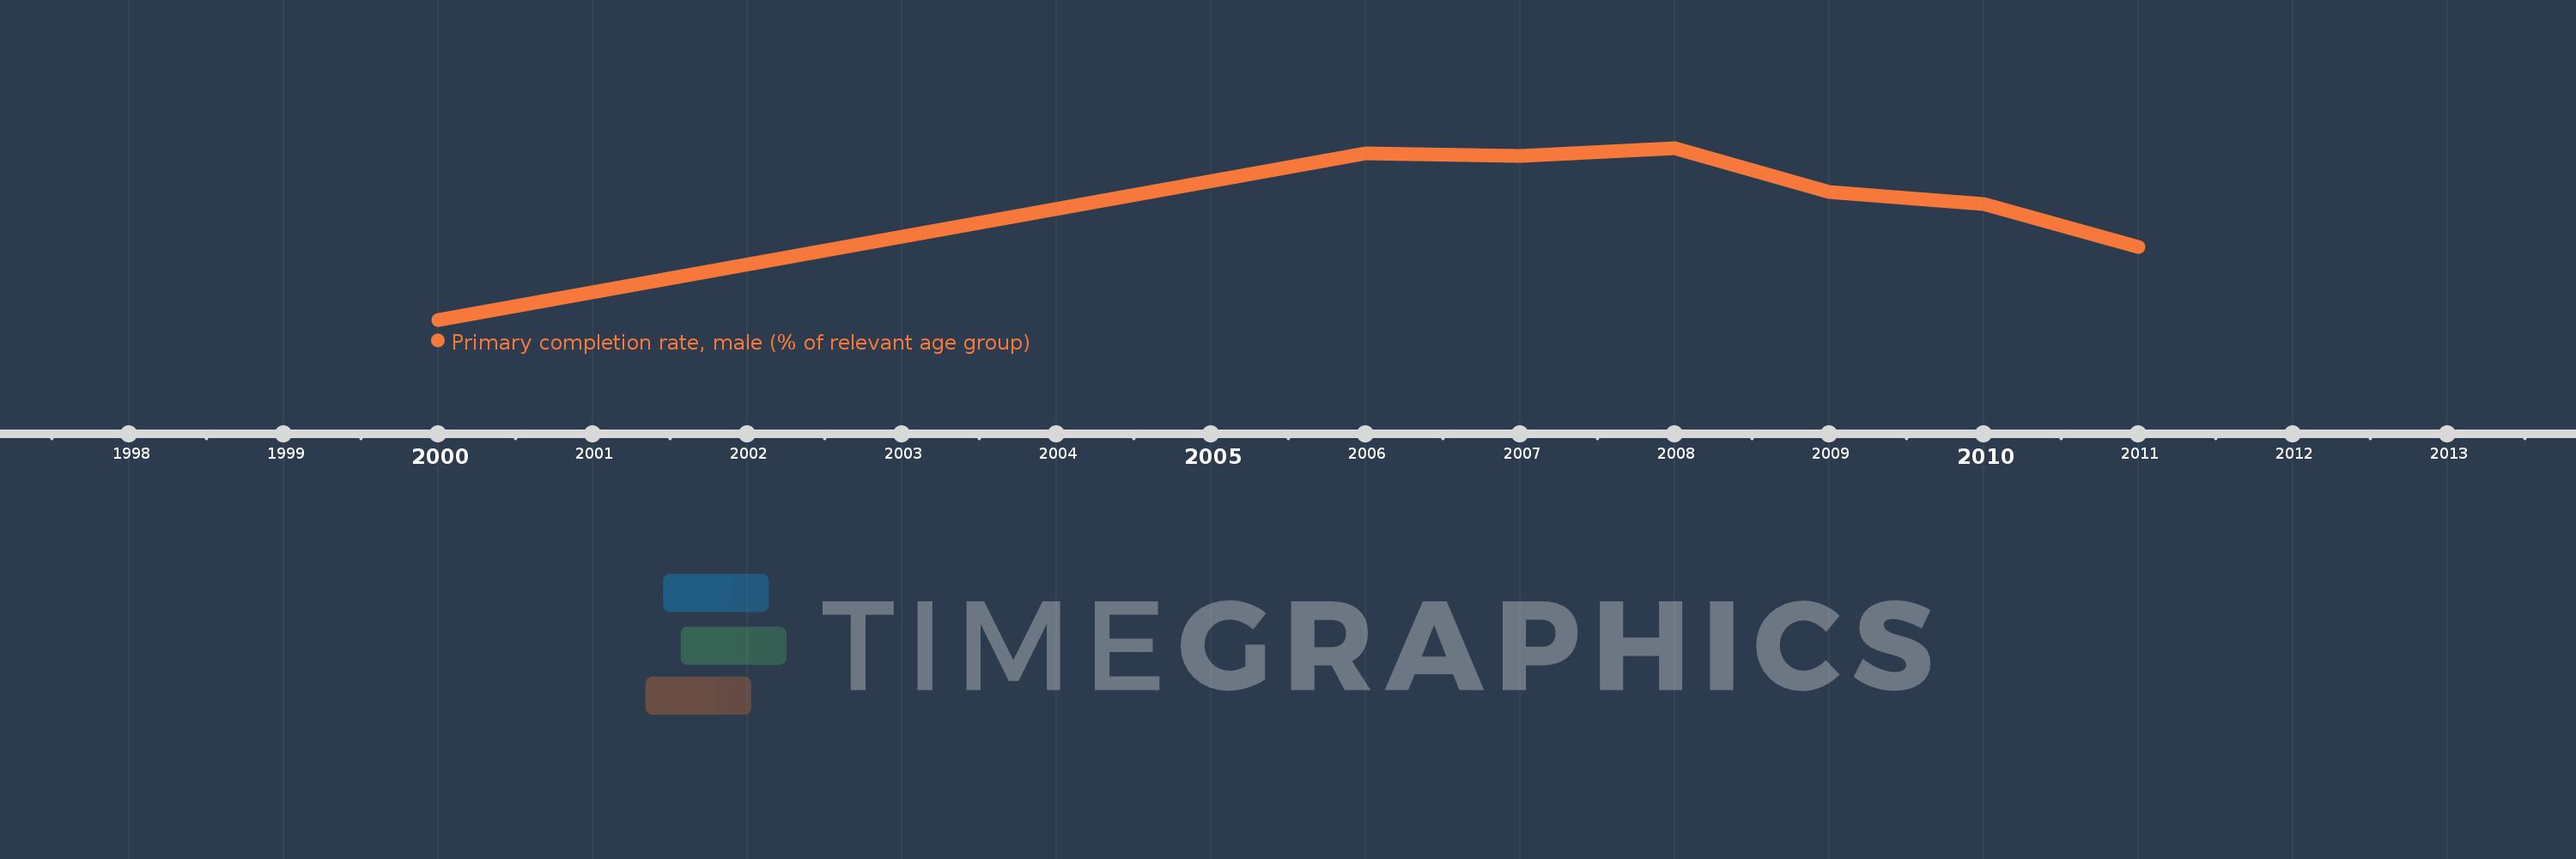
Questa scala temporale mostra un grafico dal 2000 anno al 2011 anno. Bahamas, The. I dati fino ad 1999 anno non disponibili. Il numero di osservazioni attuali secondo i date: 7.
La fonte (nome):
Indicatori dello sviluppo mondiale
La fonte (organizzazione):
United Nations Educational, Scientific, and Cultural Organization (UNESCO) Institute for Statistics.
Categorie:
Education, Gender
sono stati aggiornati
23 apr 2017 anni
Indicatori delle variazioni dei valori per anni
In media:
98.254
Minima:
80.32
1 gen 2000 anni
Massimo:
106.669
1 gen 2008 anni
Alla data di osservazione
Valore
Variazione assoluta
La variazione rispetto al valore precedente
1 gen 2000 anni
80.32
+80.32
0.0%
1 gen 2006 anni
105.852
+25.533
31.79%
1 gen 2007 anni
105.426
-0.426
-0.4%
1 gen 2008 anni
106.669
+1.243
1.18%
1 gen 2009 anni
99.898
-6.771
-6.35%
1 gen 2010 anni
98.121
-1.777
-1.78%
1 gen 2011 anni
91.49
-6.631
-6.76%
Classificazione dei paesi secondo i statistiche attuali per anni
