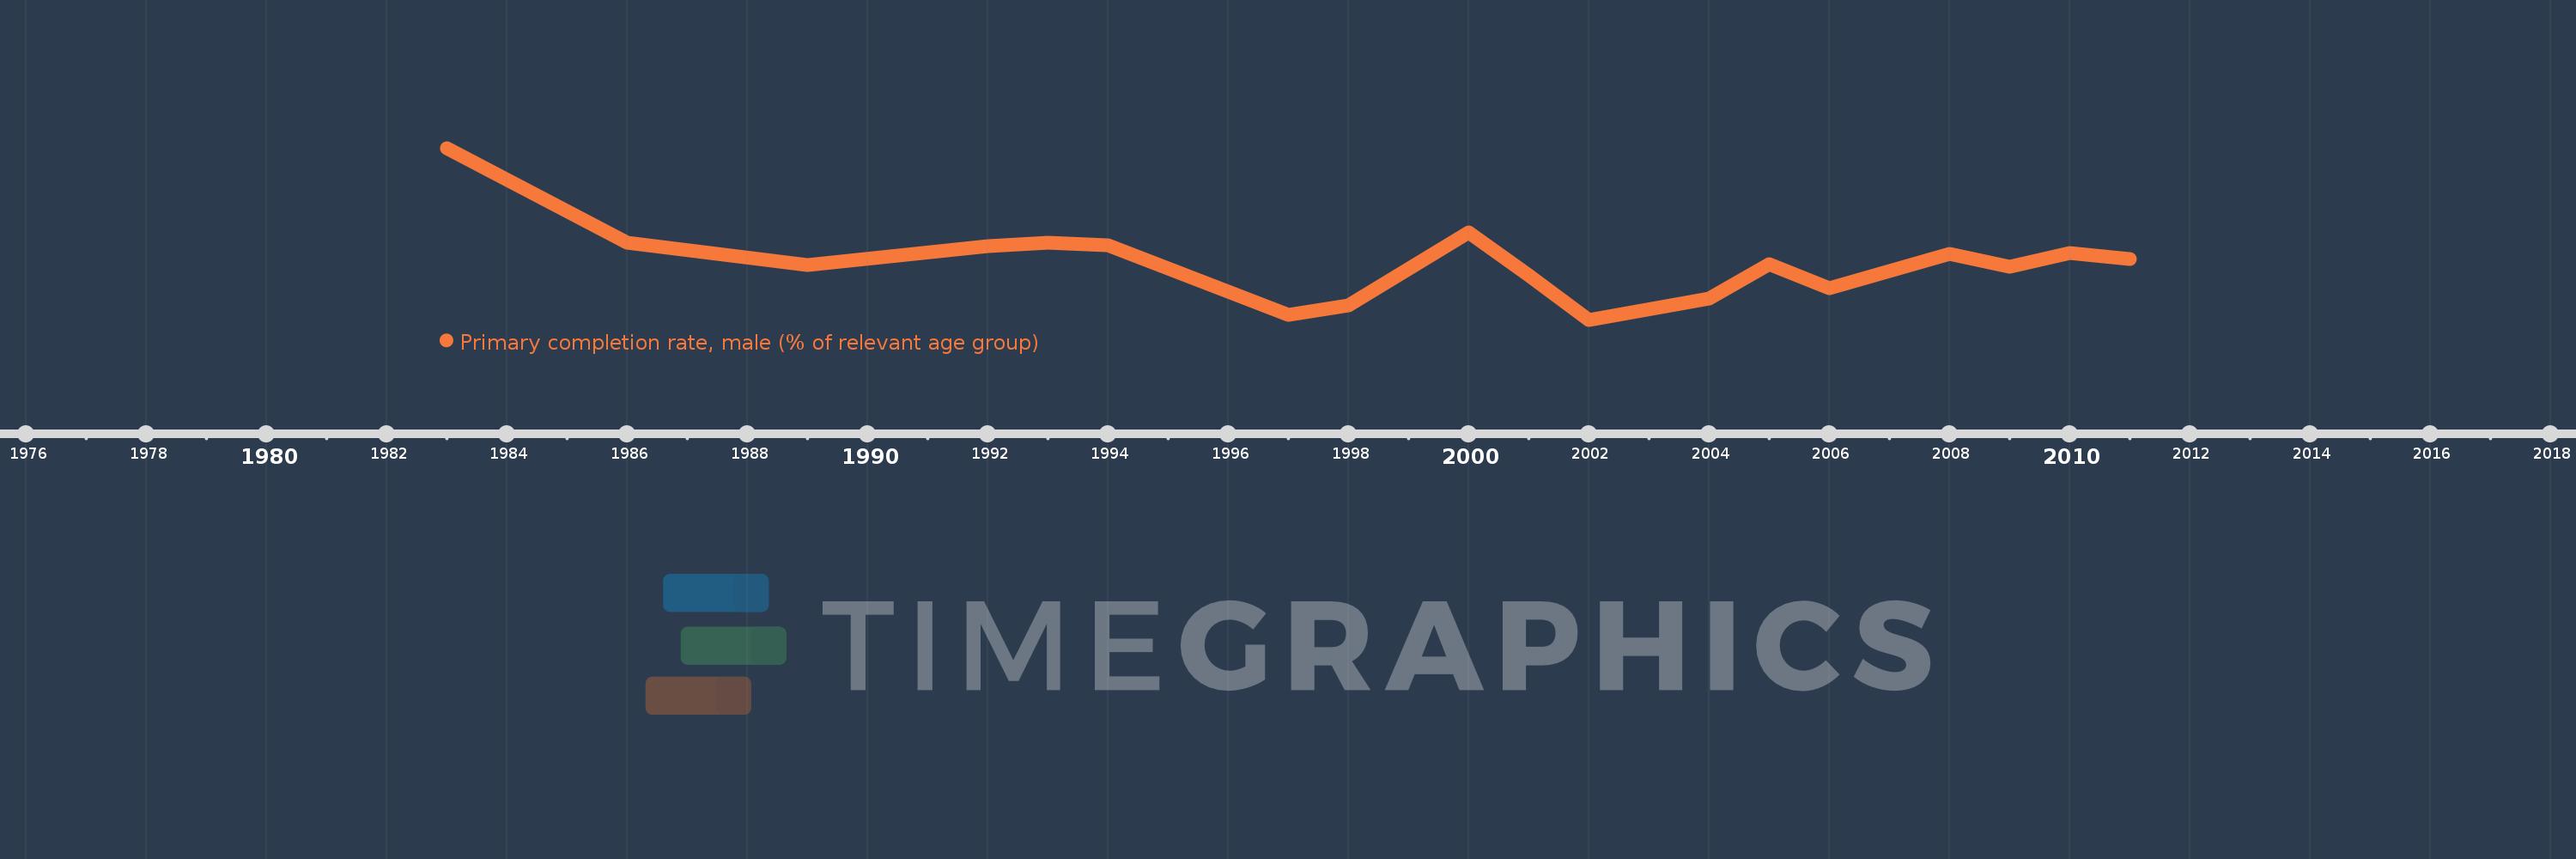
Questa scala temporale mostra un grafico dal 1983 anno al 2011 anno. Trinidad and Tobago. I dati fino ad 1982 anno non disponibili. Il numero di osservazioni attuali secondo i date: 18.
La fonte (nome):
Indicatori dello sviluppo mondiale
La fonte (organizzazione):
United Nations Educational, Scientific, and Cultural Organization (UNESCO) Institute for Statistics.
Categorie:
Education, Gender
sono stati aggiornati
23 apr 2017 anni
Indicatori delle variazioni dei valori per anni
In media:
94.226
Minima:
85.44
1 gen 2002 anni
Massimo:
111.697
1 gen 1983 anni
Alla data di osservazione
Valore
Variazione assoluta
La variazione rispetto al valore precedente
1 gen 1983 anni
111.697
+111.697
0.0%
1 gen 1986 anni
97.235
-14.462
-12.95%
1 gen 1989 anni
93.753
-3.482
-3.58%
1 gen 1992 anni
96.721
+2.968
3.17%
1 gen 1993 anni
97.202
+0.481
0.5%
1 gen 1994 anni
96.81
-0.392
-0.4%
1 gen 1997 anni
86.245
-10.564
-10.91%
1 gen 1998 anni
87.693
+1.448
1.68%
1 gen 2000 anni
98.736
+11.043
12.59%
1 gen 2001 anni
92.176
-6.561
-6.64%
1 gen 2002 anni
85.44
-6.736
-7.31%
1 gen 2004 anni
88.718
+3.279
3.84%
1 gen 2005 anni
93.957
+5.239
5.9%
1 gen 2006 anni
90.265
-3.692
-3.93%
1 gen 2008 anni
95.512
+5.248
5.81%
1 gen 2009 anni
93.6
-1.912
-2.0%
1 gen 2010 anni
95.576
+1.976
2.11%
1 gen 2011 anni
94.725
-0.851
-0.89%
Classificazione dei paesi secondo i statistiche attuali per anni
