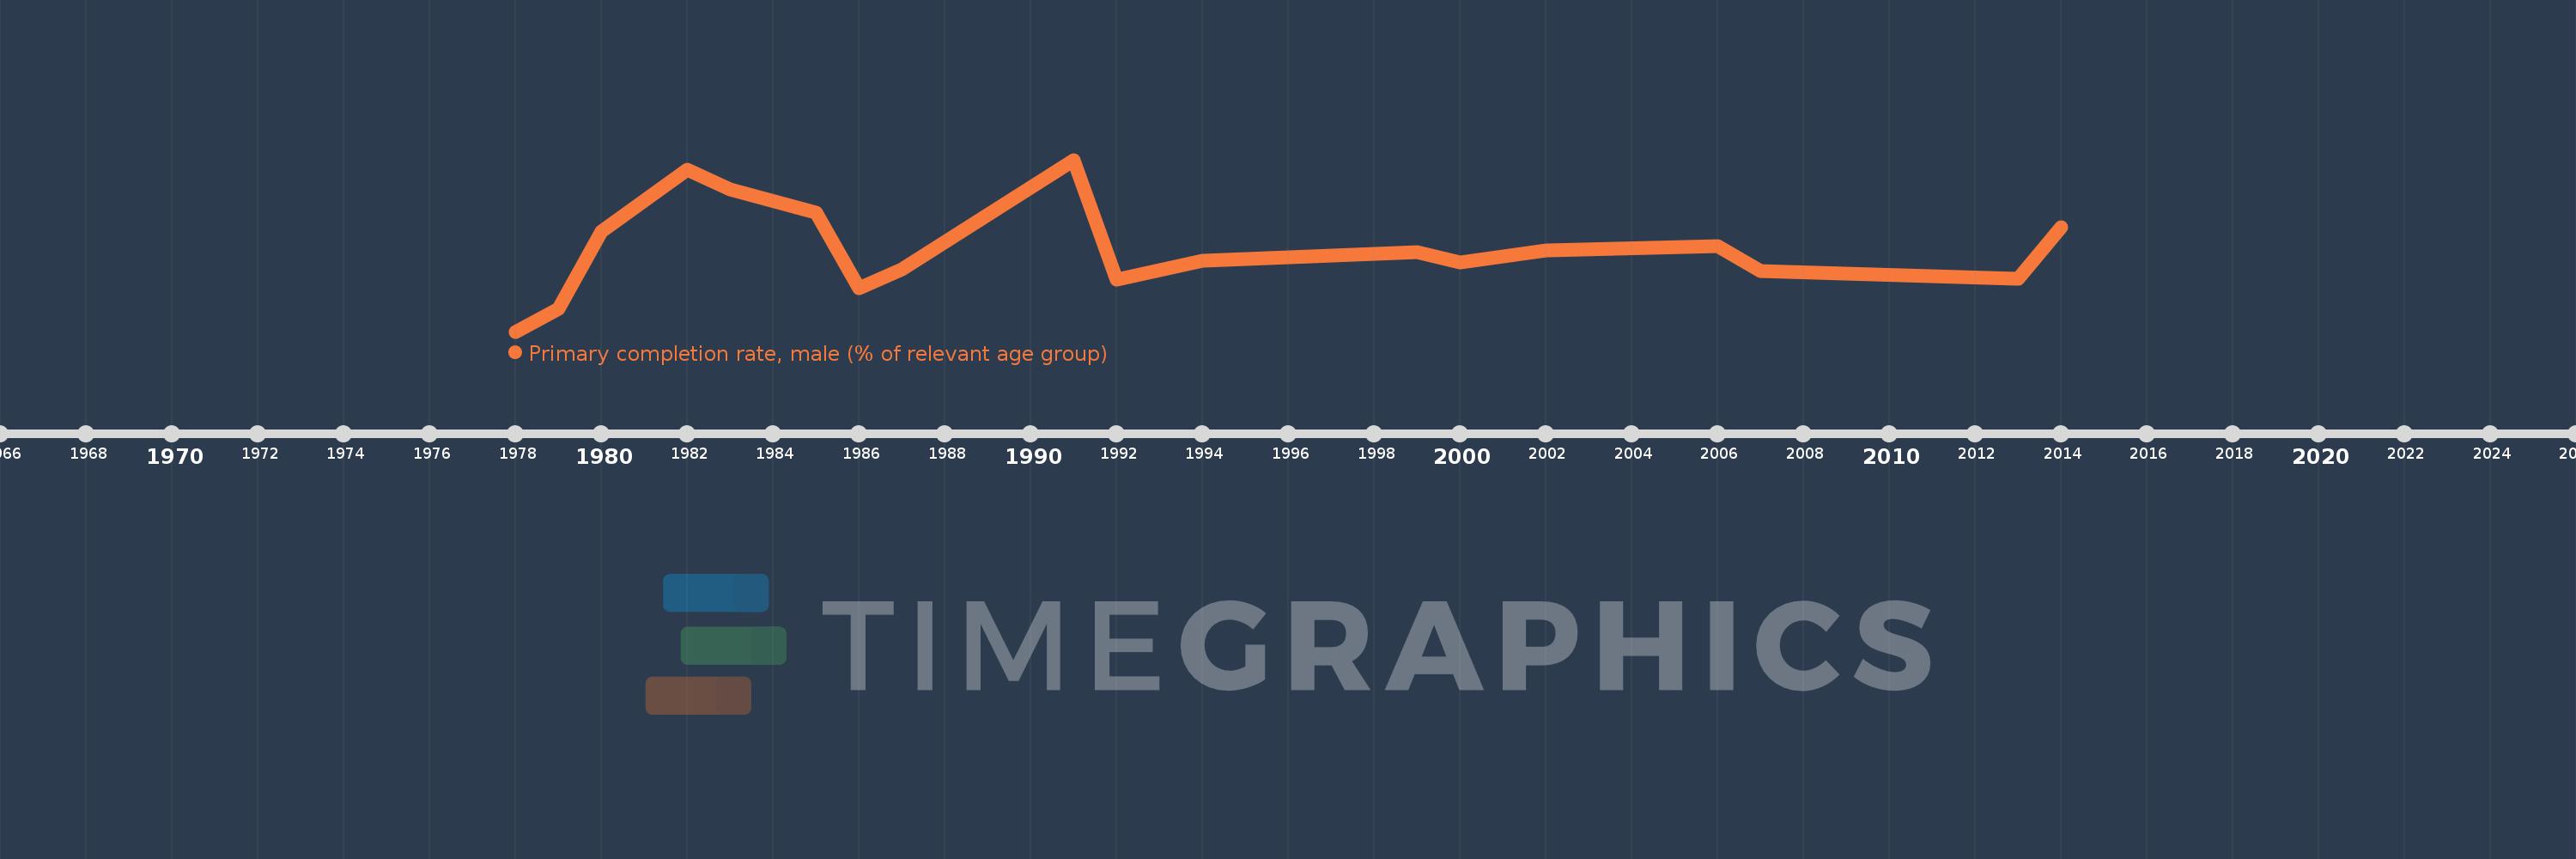
Questa scala temporale mostra un grafico dal 1978 anno al 2014 anno. Tonga. I dati fino ad 1977 anno non disponibili. Il numero di osservazioni attuali secondo i date: 18.
La fonte (nome):
Indicatori dello sviluppo mondiale
La fonte (organizzazione):
United Nations Educational, Scientific, and Cultural Organization (UNESCO) Institute for Statistics.
Categorie:
Education, Gender
sono stati aggiornati
23 apr 2017 anni
Indicatori delle variazioni dei valori per anni
In media:
108.364
Minima:
83.788
1 gen 1978 anni
Massimo:
135.135
1 gen 1991 anni
Alla data di osservazione
Valore
Variazione assoluta
La variazione rispetto al valore precedente
1 gen 1978 anni
83.788
+83.788
0.0%
1 gen 1979 anni
90.539
+6.751
8.06%
1 gen 1980 anni
113.814
+23.276
25.71%
1 gen 1982 anni
132.22
+18.405
16.17%
1 gen 1983 anni
126.357
-5.863
-4.43%
1 gen 1985 anni
119.314
-7.042
-5.57%
1 gen 1986 anni
96.691
-22.623
-18.96%
1 gen 1987 anni
102.445
+5.754
5.95%
1 gen 1991 anni
135.135
+32.69
31.91%
1 gen 1992 anni
99.292
-35.843
-26.52%
1 gen 1994 anni
104.945
+5.653
5.69%
1 gen 1999 anni
107.444
+2.5
2.38%
1 gen 2000 anni
104.542
-2.902
-2.7%
1 gen 2002 anni
108.175
+3.633
3.48%
1 gen 2006 anni
109.212
+1.037
0.96%
1 gen 2007 anni
101.879
-7.332
-6.71%
1 gen 2013 anni
99.696
-2.183
-2.14%
1 gen 2014 anni
115.067
+15.371
15.42%
Classificazione dei paesi secondo i statistiche attuali per anni
