29
/it/
it
AIzaSyAYiBZKx7MnpbEhh9jyipgxe19OcubqV5w
April 1, 2024
86298
Bhutan
BTN
true
2
1
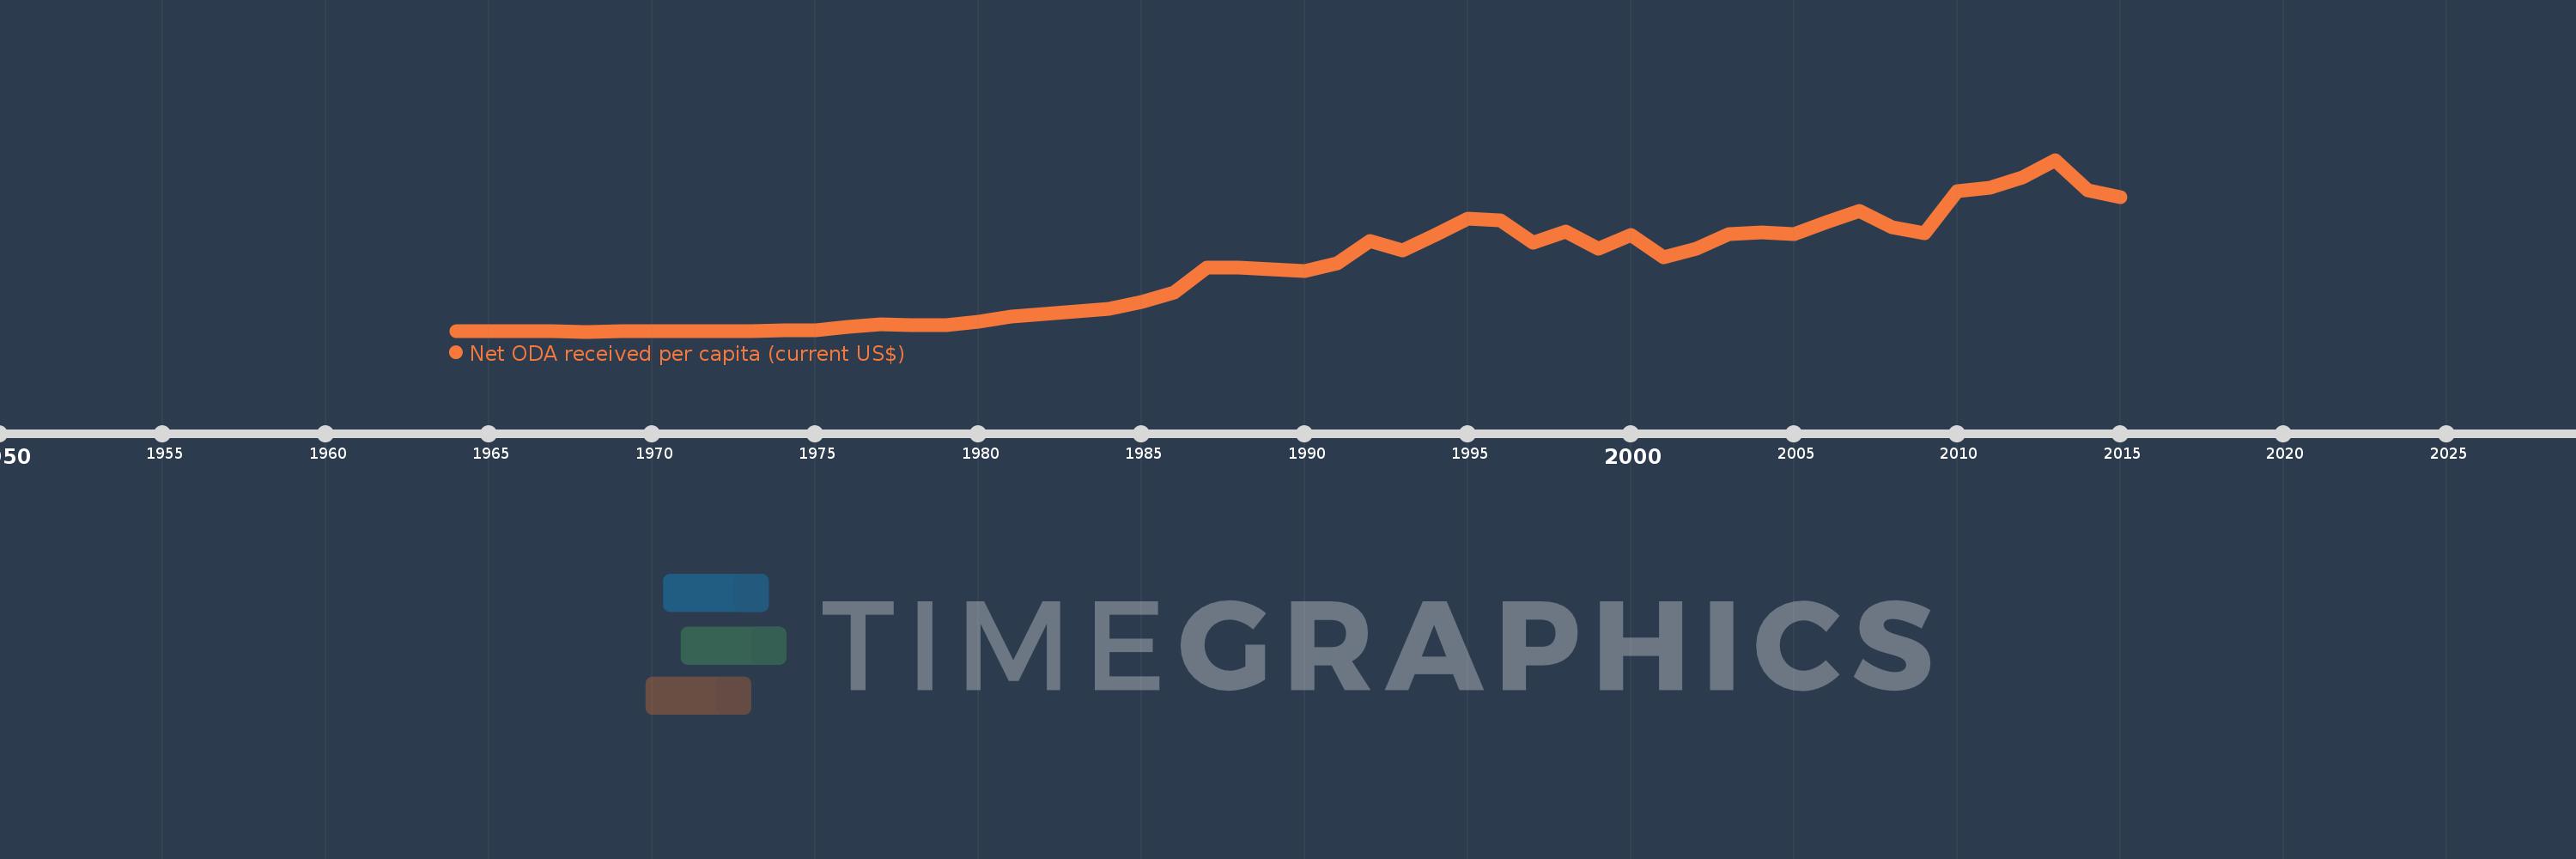
Net ODA received per capita (current US$)
2015,2014,2013,2012,2011,2010,2009,2008,2007,2006,2005,2004,2003,2002,2001,2000,1999,1998,1997,1996,1995,1994,1993,1992,1991,1990,1989,1988,1987,1986,1985,1984,1983,1982,1981,1980,1979,1978,1977,1976,1975,1974,1973,1972,1971,1970,1969,1968,1967,1966,1965,1964
Queste statistiche in altri paesi:
AfghanistanAlbaniaAlgeriaAngolaAntigua and BarbudaArab WorldArgentinaArmeniaArubaAzerbaijanBahamas, TheBahrainBangladeshBarbadosBelarusBelizeBeninBermudaBhutanBoliviaBosnia and HerzegovinaBotswanaBrazilBritish Virgin IslandsBrunei DarussalamBurkina FasoBurundiCabo VerdeCambodiaCameroonCaribbean small statesCayman IslandsCentral African RepublicCentral Europe and the BalticsChadChileChinaColombiaComorosCongo, Dem. Rep.Congo, Rep.Costa RicaCote d'IvoireCroatiaCubaCyprusDjiboutiDominicaDominican RepublicEast Asia & PacificEast Asia & Pacific (excluding high income)East Asia & Pacific (IDA & IBRD countries)EcuadorEgypt, Arab Rep.El SalvadorEquatorial GuineaEritreaEthiopiaEuro areaEurope & Central AsiaEurope & Central Asia (excluding high income)Europe & Central Asia (IDA & IBRD countries)European UnionFijiFragile and conflict affected situationsFrench PolynesiaGabonGambia, TheGeorgiaGhanaGibraltarGrenadaGuatemalaGuineaGuinea-BissauGuyanaHaitiHeavily indebted poor countries (HIPC)High incomeHondurasHong Kong SAR, ChinaIBRD onlyIDA & IBRD totalIDA blendIDA onlyIDA totalIndiaIndonesiaIran, Islamic Rep.IraqIsraelJamaicaJordanKazakhstanKenyaKiribatiKorea, Dem. People’s Rep.Korea, Rep.KosovoKuwaitKyrgyz RepublicLao PDRLatin America & Caribbean Latin America & Caribbean (excluding high income)Latin America & the Caribbean (IDA & IBRD countries)Least developed countries: UN classificationLebanonLesothoLiberiaLibyaLow & middle incomeLow incomeLower middle incomeMacao SAR, ChinaMacedonia, FYRMadagascarMalawiMalaysiaMaldivesMaliMaltaMarshall IslandsMauritaniaMauritiusMexicoMicronesia, Fed. Sts.Middle East & North AfricaMiddle East & North Africa (excluding high income)Middle East & North Africa (IDA & IBRD countries)Middle incomeMoldovaMongoliaMontenegroMoroccoMozambiqueMyanmarNamibiaNauruNepalNew CaledoniaNicaraguaNigerNigeriaNorth AmericaNorthern Mariana IslandsOECD membersOmanOther small statesPacific island small statesPakistanPalauPanamaPapua New GuineaParaguayPeruPhilippinesQatarRwandaSamoaSao Tome and PrincipeSaudi ArabiaSenegalSerbiaSeychellesSierra LeoneSingaporeSloveniaSmall statesSolomon IslandsSomaliaSouth AfricaSouth AsiaSouth Asia (IDA & IBRD)South SudanSri LankaSt. Kitts and NevisSt. LuciaSt. Vincent and the GrenadinesSub-Saharan Africa Sub-Saharan Africa (excluding high income)Sub-Saharan Africa (IDA & IBRD countries)SudanSurinameSwazilandSyrian Arab RepublicTajikistanTanzaniaThailandTimor-LesteTogoTongaTrinidad and TobagoTunisiaTurkeyTurkmenistanTurks and Caicos IslandsTuvaluUgandaUkraineUnited Arab EmiratesUpper middle incomeUruguayUzbekistanVanuatuVenezuela, RBVietnamWest Bank and GazaWorldYemen, Rep.ZambiaZimbabwe Linea del tempo:
Questa scala temporale mostra un grafico dal 1964 anno al 2015 anno. Bhutan. I dati fino ad 1963 anno non disponibili. Il numero di osservazioni attuali secondo i date: 52.
La fonte (nome):
Indicatori dello sviluppo mondiale
La fonte (organizzazione):
Development Assistance Committee of the Organisation for Economic Co-operation and Development, Geographical Distribution of Financial Flows to Developing Countries, Development Co-operation Report, and International Development Statistics database. Data are available online at: www.oecd.org/dac/stats/idsonline. World Bank population estimates are used for the denominator.
Categorie:
Aid Effectiveness, Economy & Growth, External Debt
sono stati aggiornati
23 apr 2017 anni
Indicatori delle variazioni dei valori per anni
Minima:
0.038
1 gen 1968 anni
Massimo:
216.858
1 gen 2013 anni
Alla data di osservazione
Valore
Variazione assoluta
La variazione rispetto al valore precedente
1 gen 1964 anni
0.042
+0.042
0.0%
1 gen 1965 anni
0.041
-0.001
-2.42%
1 gen 1966 anni
0.633
+0.593
1.46 Mille.%
1 gen 1967 anni
0.193
-0.44
-69.55%
1 gen 1968 anni
0.038
-0.155
-80.53%
1 gen 1969 anni
0.511
+0.474
1.26 Mille.%
1 gen 1970 anni
0.354
-0.157
-30.68%
1 gen 1971 anni
0.721
+0.366
103.34%
1 gen 1972 anni
0.464
-0.256
-35.59%
1 gen 1973 anni
0.608
+0.143
30.91%
1 gen 1974 anni
1.603
+0.995
163.77%
1 gen 1975 anni
1.812
+0.209
13.05%
1 gen 1976 anni
6.015
+4.203
231.97%
1 gen 1977 anni
8.898
+2.884
47.95%
1 gen 1978 anni
7.737
-1.161
-13.05%
1 gen 1979 anni
8.047
+0.309
4.0%
1 gen 1980 anni
12.388
+4.341
53.95%
1 gen 1981 anni
19.537
+7.148
57.7%
1 gen 1982 anni
22.766
+3.229
16.53%
1 gen 1983 anni
25.899
+3.133
13.76%
1 gen 1984 anni
29.047
+3.149
12.16%
1 gen 1985 anni
37.796
+8.748
30.12%
1 gen 1986 anni
49.871
+12.075
31.95%
1 gen 1987 anni
80.409
+30.538
61.23%
1 gen 1988 anni
80.766
+0.357
0.44%
1 gen 1989 anni
78.616
-2.15
-2.66%
1 gen 1990 anni
76.651
-1.966
-2.5%
1 gen 1991 anni
85.9
+9.25
12.07%
1 gen 1992 anni
114.854
+28.954
33.71%
1 gen 1993 anni
102.559
-12.295
-10.7%
1 gen 1994 anni
121.712
+19.153
18.67%
1 gen 1995 anni
142.946
+21.234
17.45%
1 gen 1996 anni
139.95
-2.996
-2.1%
1 gen 1997 anni
112.066
-27.884
-19.92%
1 gen 1998 anni
125.893
+13.827
12.34%
1 gen 1999 anni
104.554
-21.34
-16.95%
1 gen 2000 anni
121.848
+17.295
16.54%
1 gen 2001 anni
94.1
-27.748
-22.77%
1 gen 2002 anni
104.135
+10.035
10.66%
1 gen 2003 anni
122.957
+18.822
18.07%
1 gen 2004 anni
125.455
+2.498
2.03%
1 gen 2005 anni
122.936
-2.52
-2.01%
1 gen 2006 anni
138.291
+15.356
12.49%
1 gen 2007 anni
152.252
+13.961
10.1%
1 gen 2008 anni
131.818
-20.434
-13.42%
1 gen 2009 anni
124.505
-7.312
-5.55%
1 gen 2010 anni
177.133
+52.628
42.27%
1 gen 2011 anni
181.174
+4.041
2.28%
1 gen 2012 anni
194.771
+13.596
7.5%
1 gen 2013 anni
216.858
+22.088
11.34%
1 gen 2014 anni
178.019
-38.839
-17.91%
1 gen 2015 anni
169.632
-8.387
-4.71%
Classificazione dei paesi secondo i statistiche attuali per anni


Commenti: