29
/it/
it
AIzaSyAYiBZKx7MnpbEhh9jyipgxe19OcubqV5w
April 1, 2024
147182
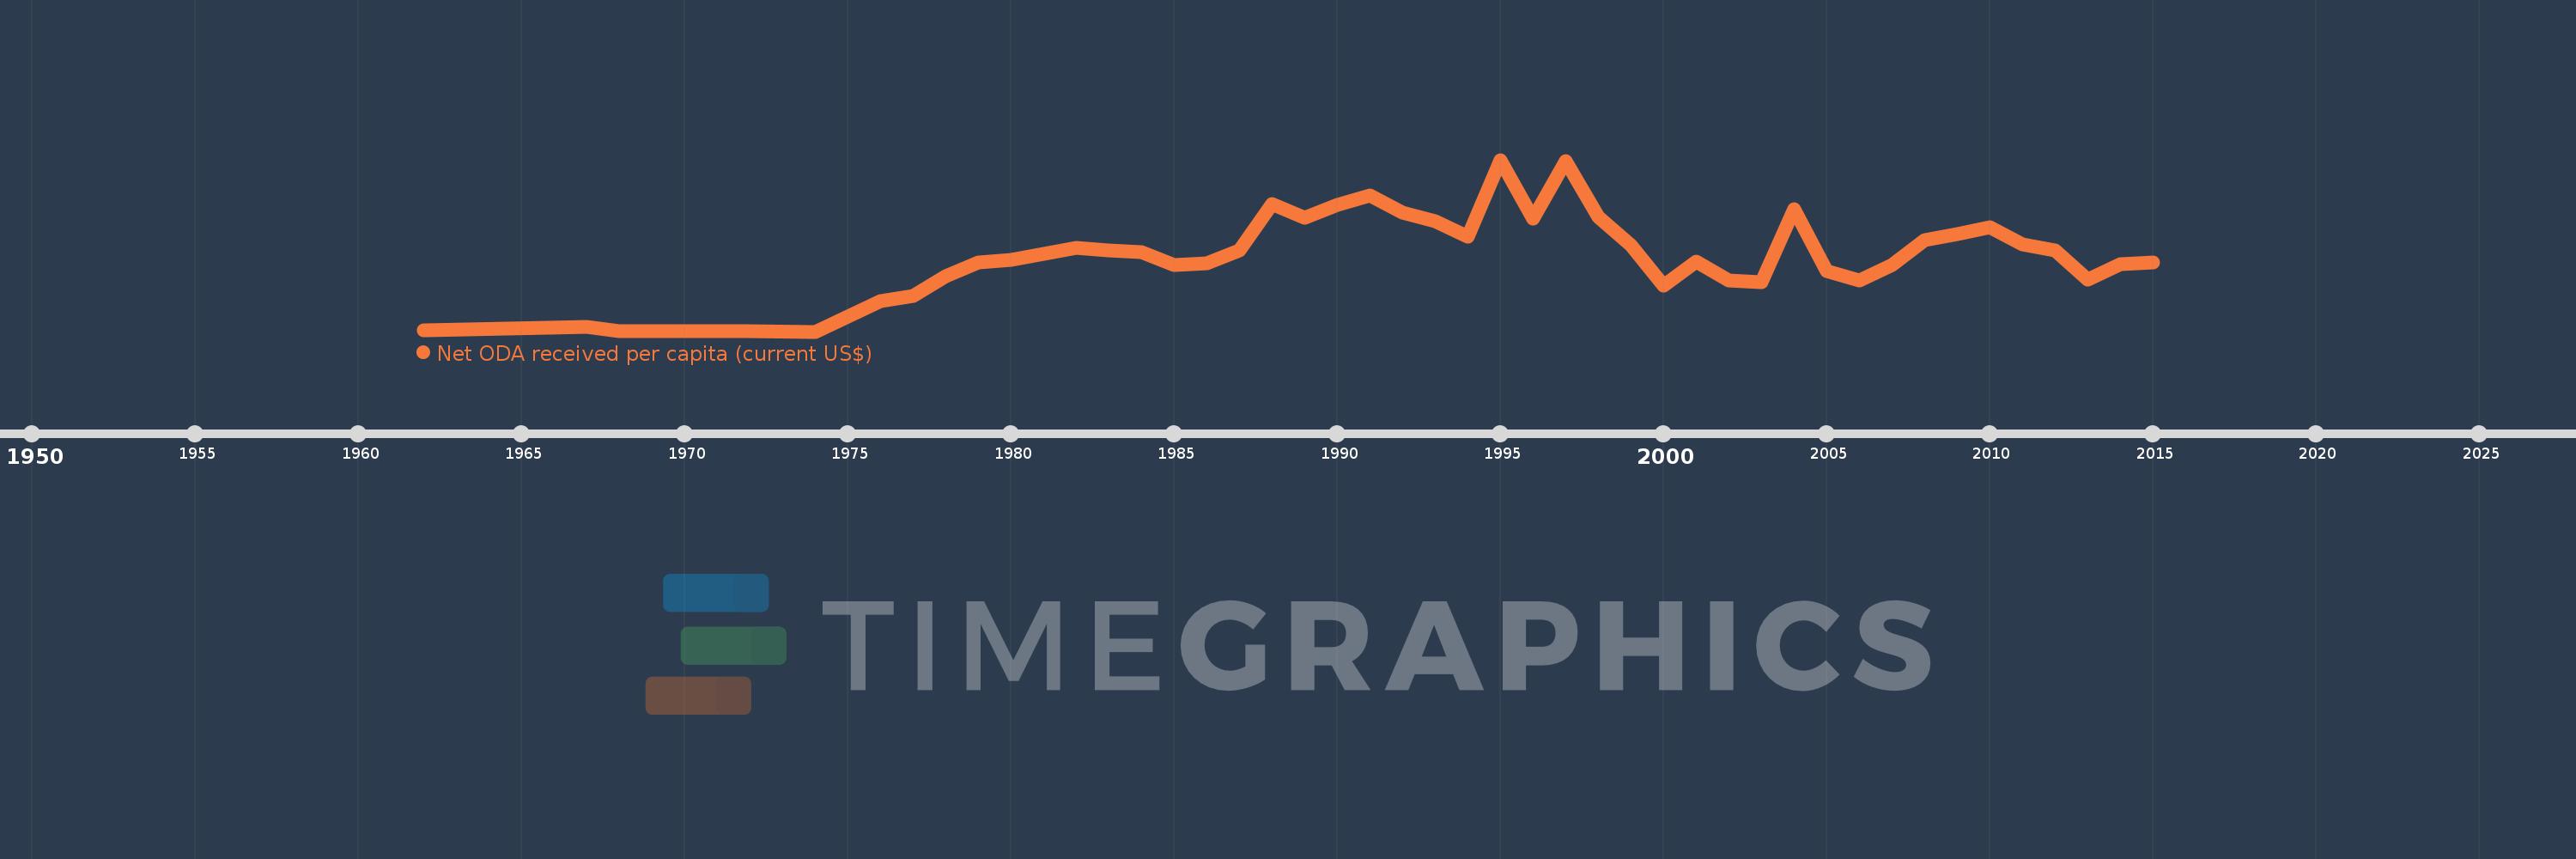
Guinea-Bissau
GNB
true
2
1
Net ODA received per capita (current US$)
2015,2014,2013,2012,2011,2010,2009,2008,2007,2006,2005,2004,2003,2002,2001,2000,1999,1998,1997,1996,1995,1994,1993,1992,1991,1990,1989,1988,1987,1986,1985,1984,1983,1982,1981,1980,1979,1978,1977,1976,1975,1974,1972,1970,1968,1967,1962
Queste statistiche in altri paesi:
AfghanistanAlbaniaAlgeriaAngolaAntigua and BarbudaArab WorldArgentinaArmeniaArubaAzerbaijanBahamas, TheBahrainBangladeshBarbadosBelarusBelizeBeninBermudaBhutanBoliviaBosnia and HerzegovinaBotswanaBrazilBritish Virgin IslandsBrunei DarussalamBurkina FasoBurundiCabo VerdeCambodiaCameroonCaribbean small statesCayman IslandsCentral African RepublicCentral Europe and the BalticsChadChileChinaColombiaComorosCongo, Dem. Rep.Congo, Rep.Costa RicaCote d'IvoireCroatiaCubaCyprusDjiboutiDominicaDominican RepublicEast Asia & PacificEast Asia & Pacific (excluding high income)East Asia & Pacific (IDA & IBRD countries)EcuadorEgypt, Arab Rep.El SalvadorEquatorial GuineaEritreaEthiopiaEuro areaEurope & Central AsiaEurope & Central Asia (excluding high income)Europe & Central Asia (IDA & IBRD countries)European UnionFijiFragile and conflict affected situationsFrench PolynesiaGabonGambia, TheGeorgiaGhanaGibraltarGrenadaGuatemalaGuineaGuinea-BissauGuyanaHaitiHeavily indebted poor countries (HIPC)High incomeHondurasHong Kong SAR, ChinaIBRD onlyIDA & IBRD totalIDA blendIDA onlyIDA totalIndiaIndonesiaIran, Islamic Rep.IraqIsraelJamaicaJordanKazakhstanKenyaKiribatiKorea, Dem. People’s Rep.Korea, Rep.KosovoKuwaitKyrgyz RepublicLao PDRLatin America & Caribbean Latin America & Caribbean (excluding high income)Latin America & the Caribbean (IDA & IBRD countries)Least developed countries: UN classificationLebanonLesothoLiberiaLibyaLow & middle incomeLow incomeLower middle incomeMacao SAR, ChinaMacedonia, FYRMadagascarMalawiMalaysiaMaldivesMaliMaltaMarshall IslandsMauritaniaMauritiusMexicoMicronesia, Fed. Sts.Middle East & North AfricaMiddle East & North Africa (excluding high income)Middle East & North Africa (IDA & IBRD countries)Middle incomeMoldovaMongoliaMontenegroMoroccoMozambiqueMyanmarNamibiaNauruNepalNew CaledoniaNicaraguaNigerNigeriaNorth AmericaNorthern Mariana IslandsOECD membersOmanOther small statesPacific island small statesPakistanPalauPanamaPapua New GuineaParaguayPeruPhilippinesQatarRwandaSamoaSao Tome and PrincipeSaudi ArabiaSenegalSerbiaSeychellesSierra LeoneSingaporeSloveniaSmall statesSolomon IslandsSomaliaSouth AfricaSouth AsiaSouth Asia (IDA & IBRD)South SudanSri LankaSt. Kitts and NevisSt. LuciaSt. Vincent and the GrenadinesSub-Saharan Africa Sub-Saharan Africa (excluding high income)Sub-Saharan Africa (IDA & IBRD countries)SudanSurinameSwazilandSyrian Arab RepublicTajikistanTanzaniaThailandTimor-LesteTogoTongaTrinidad and TobagoTunisiaTurkeyTurkmenistanTurks and Caicos IslandsTuvaluUgandaUkraineUnited Arab EmiratesUpper middle incomeUruguayUzbekistanVanuatuVenezuela, RBVietnamWest Bank and GazaWorldYemen, Rep.ZambiaZimbabwe Linea del tempo:
Questa scala temporale mostra un grafico dal 1962 anno al 2015 anno. Guinea-Bissau. I dati fino ad 1961 anno non disponibili. Il numero di osservazioni attuali secondo i date: 47.
La fonte (nome):
Indicatori dello sviluppo mondiale
La fonte (organizzazione):
Development Assistance Committee of the Organisation for Economic Co-operation and Development, Geographical Distribution of Financial Flows to Developing Countries, Development Co-operation Report, and International Development Statistics database. Data are available online at: www.oecd.org/dac/stats/idsonline. World Bank population estimates are used for the denominator.
Categorie:
Aid Effectiveness, Economy & Growth, External Debt
sono stati aggiornati
23 apr 2017 anni
Indicatori delle variazioni dei valori per anni
Minima:
0.013
1 gen 1974 anni
Massimo:
150.947
1 gen 1995 anni
Alla data di osservazione
Valore
Variazione assoluta
La variazione rispetto al valore precedente
1 gen 1962 anni
1.299
+1.299
0.0%
1 gen 1967 anni
4.241
+2.942
226.4%
1 gen 1968 anni
0.757
-3.484
-82.15%
1 gen 1970 anni
0.1
-0.657
-86.77%
1 gen 1972 anni
0.152
+0.052
51.52%
1 gen 1974 anni
0.013
-0.138
-91.23%
1 gen 1975 anni
13.151
+13.137
98.73 Mille.%
1 gen 1976 anni
26.667
+13.517
102.78%
1 gen 1977 anni
31.378
+4.711
17.66%
1 gen 1978 anni
48.48
+17.102
54.5%
1 gen 1979 anni
60.546
+12.066
24.89%
1 gen 1980 anni
62.98
+2.434
4.02%
1 gen 1981 anni
68.362
+5.382
8.54%
1 gen 1982 anni
73.961
+5.599
8.19%
1 gen 1983 anni
71.433
-2.528
-3.42%
1 gen 1984 anni
69.693
-1.74
-2.44%
1 gen 1985 anni
58.84
-10.854
-15.57%
1 gen 1986 anni
59.76
+0.921
1.56%
1 gen 1987 anni
71.684
+11.924
19.95%
1 gen 1988 anni
112.451
+40.767
56.87%
1 gen 1989 anni
99.825
-12.626
-11.23%
1 gen 1990 anni
111.251
+11.426
11.45%
1 gen 1991 anni
119.626
+8.375
7.53%
1 gen 1992 anni
104.444
-15.182
-12.69%
1 gen 1993 anni
97.13
-7.315
-7.0%
1 gen 1994 anni
83.677
-13.453
-13.85%
1 gen 1995 anni
150.947
+67.27
80.39%
1 gen 1996 anni
99.587
-51.36
-34.02%
1 gen 1997 anni
149.767
+50.18
50.39%
1 gen 1998 anni
100.809
-48.958
-32.69%
1 gen 1999 anni
76.03
-24.779
-24.58%
1 gen 2000 anni
40.707
-35.323
-46.46%
1 gen 2001 anni
61.629
+20.921
51.39%
1 gen 2002 anni
45.176
-16.453
-26.7%
1 gen 2003 anni
43.749
-1.426
-3.16%
1 gen 2004 anni
107.326
+63.576
145.32%
1 gen 2005 anni
53.352
-53.974
-50.29%
1 gen 2006 anni
45.14
-8.212
-15.39%
1 gen 2007 anni
58.223
+13.083
28.98%
1 gen 2008 anni
80.087
+21.864
37.55%
1 gen 2009 anni
85.685
+5.599
6.99%
1 gen 2010 anni
91.775
+6.09
7.11%
1 gen 2011 anni
76.729
-15.047
-16.4%
1 gen 2012 anni
71.514
-5.214
-6.8%
1 gen 2013 anni
45.999
-25.516
-35.68%
1 gen 2014 anni
59.227
+13.228
28.76%
1 gen 2015 anni
60.411
+1.184
2.0%
Classificazione dei paesi secondo i statistiche attuali per anni


Commenti: