29
/it/
it
AIzaSyAYiBZKx7MnpbEhh9jyipgxe19OcubqV5w
April 1, 2024
148304
Guyana
GUY
true
2
1
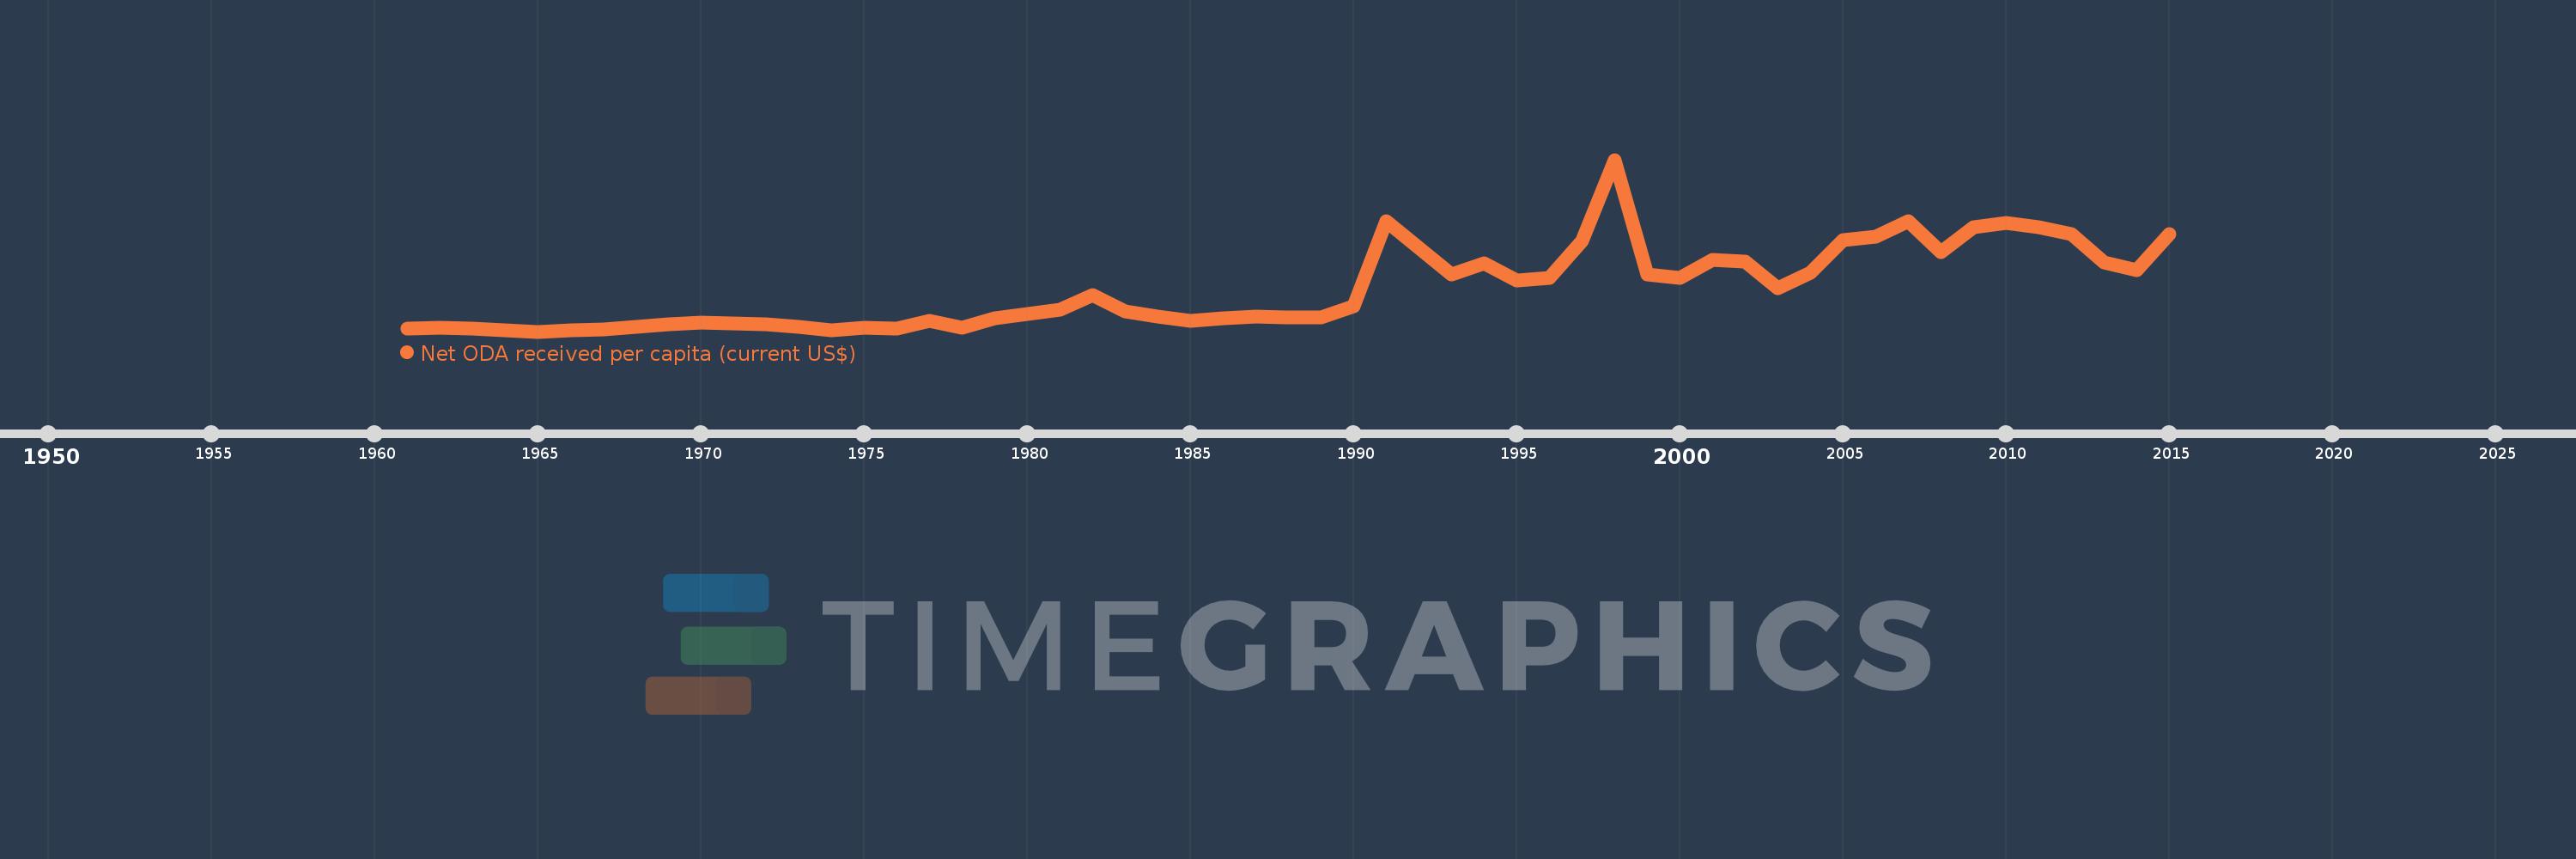
Net ODA received per capita (current US$)
2015,2014,2013,2012,2011,2010,2009,2008,2007,2006,2005,2004,2003,2002,2001,2000,1999,1998,1997,1996,1995,1994,1993,1992,1991,1990,1989,1988,1987,1986,1985,1984,1983,1982,1981,1980,1979,1978,1977,1976,1975,1974,1973,1972,1971,1970,1969,1968,1967,1966,1965,1964,1963,1962,1961
Queste statistiche in altri paesi:
AfghanistanAlbaniaAlgeriaAngolaAntigua and BarbudaArab WorldArgentinaArmeniaArubaAzerbaijanBahamas, TheBahrainBangladeshBarbadosBelarusBelizeBeninBermudaBhutanBoliviaBosnia and HerzegovinaBotswanaBrazilBritish Virgin IslandsBrunei DarussalamBurkina FasoBurundiCabo VerdeCambodiaCameroonCaribbean small statesCayman IslandsCentral African RepublicCentral Europe and the BalticsChadChileChinaColombiaComorosCongo, Dem. Rep.Congo, Rep.Costa RicaCote d'IvoireCroatiaCubaCyprusDjiboutiDominicaDominican RepublicEast Asia & PacificEast Asia & Pacific (excluding high income)East Asia & Pacific (IDA & IBRD countries)EcuadorEgypt, Arab Rep.El SalvadorEquatorial GuineaEritreaEthiopiaEuro areaEurope & Central AsiaEurope & Central Asia (excluding high income)Europe & Central Asia (IDA & IBRD countries)European UnionFijiFragile and conflict affected situationsFrench PolynesiaGabonGambia, TheGeorgiaGhanaGibraltarGrenadaGuatemalaGuineaGuinea-BissauGuyanaHaitiHeavily indebted poor countries (HIPC)High incomeHondurasHong Kong SAR, ChinaIBRD onlyIDA & IBRD totalIDA blendIDA onlyIDA totalIndiaIndonesiaIran, Islamic Rep.IraqIsraelJamaicaJordanKazakhstanKenyaKiribatiKorea, Dem. People’s Rep.Korea, Rep.KosovoKuwaitKyrgyz RepublicLao PDRLatin America & Caribbean Latin America & Caribbean (excluding high income)Latin America & the Caribbean (IDA & IBRD countries)Least developed countries: UN classificationLebanonLesothoLiberiaLibyaLow & middle incomeLow incomeLower middle incomeMacao SAR, ChinaMacedonia, FYRMadagascarMalawiMalaysiaMaldivesMaliMaltaMarshall IslandsMauritaniaMauritiusMexicoMicronesia, Fed. Sts.Middle East & North AfricaMiddle East & North Africa (excluding high income)Middle East & North Africa (IDA & IBRD countries)Middle incomeMoldovaMongoliaMontenegroMoroccoMozambiqueMyanmarNamibiaNauruNepalNew CaledoniaNicaraguaNigerNigeriaNorth AmericaNorthern Mariana IslandsOECD membersOmanOther small statesPacific island small statesPakistanPalauPanamaPapua New GuineaParaguayPeruPhilippinesQatarRwandaSamoaSao Tome and PrincipeSaudi ArabiaSenegalSerbiaSeychellesSierra LeoneSingaporeSloveniaSmall statesSolomon IslandsSomaliaSouth AfricaSouth AsiaSouth Asia (IDA & IBRD)South SudanSri LankaSt. Kitts and NevisSt. LuciaSt. Vincent and the GrenadinesSub-Saharan Africa Sub-Saharan Africa (excluding high income)Sub-Saharan Africa (IDA & IBRD countries)SudanSurinameSwazilandSyrian Arab RepublicTajikistanTanzaniaThailandTimor-LesteTogoTongaTrinidad and TobagoTunisiaTurkeyTurkmenistanTurks and Caicos IslandsTuvaluUgandaUkraineUnited Arab EmiratesUpper middle incomeUruguayUzbekistanVanuatuVenezuela, RBVietnamWest Bank and GazaWorldYemen, Rep.ZambiaZimbabwe Linea del tempo:
Questa scala temporale mostra un grafico dal 1961 anno al 2015 anno. Guyana. I dati fino ad 1960 anno non disponibili. Il numero di osservazioni attuali secondo i date: 55.
La fonte (nome):
Indicatori dello sviluppo mondiale
La fonte (organizzazione):
Development Assistance Committee of the Organisation for Economic Co-operation and Development, Geographical Distribution of Financial Flows to Developing Countries, Development Co-operation Report, and International Development Statistics database. Data are available online at: www.oecd.org/dac/stats/idsonline. World Bank population estimates are used for the denominator.
Categorie:
Aid Effectiveness, Economy & Growth, External Debt
sono stati aggiornati
23 apr 2017 anni
Indicatori delle variazioni dei valori per anni
Minima:
7.974
1 gen 1965 anni
Massimo:
360.603
1 gen 1998 anni
Alla data di osservazione
Valore
Variazione assoluta
La variazione rispetto al valore precedente
1 gen 1961 anni
13.417
+13.417
0.0%
1 gen 1962 anni
16.116
+2.699
20.12%
1 gen 1963 anni
13.854
-2.262
-14.04%
1 gen 1964 anni
9.937
-3.917
-28.27%
1 gen 1965 anni
7.974
-1.963
-19.75%
1 gen 1966 anni
10.748
+2.773
34.77%
1 gen 1967 anni
13.09
+2.343
21.8%
1 gen 1968 anni
16.89
+3.8
29.03%
1 gen 1969 anni
22.292
+5.402
31.98%
1 gen 1970 anni
26.321
+4.029
18.08%
1 gen 1971 anni
24.412
-1.909
-7.25%
1 gen 1972 anni
23.344
-1.068
-4.37%
1 gen 1973 anni
17.495
-5.849
-25.06%
1 gen 1974 anni
11.222
-6.274
-35.86%
1 gen 1975 anni
16.625
+5.403
48.15%
1 gen 1976 anni
13.646
-2.979
-17.92%
1 gen 1977 anni
29.334
+15.688
114.97%
1 gen 1978 anni
15.227
-14.107
-48.09%
1 gen 1979 anni
35.837
+20.609
135.35%
1 gen 1980 anni
43.752
+7.915
22.09%
1 gen 1981 anni
53.05
+9.298
21.25%
1 gen 1982 anni
83.404
+30.354
57.22%
1 gen 1983 anni
49.614
-33.791
-40.51%
1 gen 1984 anni
39.251
-10.363
-20.89%
1 gen 1985 anni
29.794
-9.456
-24.09%
1 gen 1986 anni
35.122
+5.328
17.88%
1 gen 1987 anni
39.518
+4.396
12.52%
1 gen 1988 anni
37.066
-2.452
-6.2%
1 gen 1989 anni
36.673
-0.393
-1.06%
1 gen 1990 anni
60.531
+23.858
65.06%
1 gen 1991 anni
233.672
+173.141
286.04%
1 gen 1992 anni
180.32
-53.352
-22.83%
1 gen 1993 anni
125.191
-55.129
-30.57%
1 gen 1994 anni
147.699
+22.508
17.98%
1 gen 1995 anni
112.426
-35.273
-23.88%
1 gen 1996 anni
117.917
+5.491
4.88%
1 gen 1997 anni
194.195
+76.278
64.69%
1 gen 1998 anni
360.603
+166.408
85.69%
1 gen 1999 anni
125.984
-234.619
-65.06%
1 gen 2000 anni
117.767
-8.217
-6.52%
1 gen 2001 anni
156.073
+38.306
32.53%
1 gen 2002 anni
150.896
-5.177
-3.32%
1 gen 2003 anni
96.662
-54.234
-35.94%
1 gen 2004 anni
129.367
+32.706
33.84%
1 gen 2005 anni
195.564
+66.196
51.17%
1 gen 2006 anni
201.927
+6.364
3.25%
1 gen 2007 anni
234.394
+32.467
16.08%
1 gen 2008 anni
171.464
-62.93
-26.85%
1 gen 2009 anni
222.271
+50.807
29.63%
1 gen 2010 anni
230.903
+8.632
3.88%
1 gen 2011 anni
221.447
-9.455
-4.09%
1 gen 2012 anni
208.908
-12.539
-5.66%
1 gen 2013 anni
150.591
-58.317
-27.91%
1 gen 2014 anni
133.398
-17.194
-11.42%
1 gen 2015 anni
208.524
+75.126
56.32%
Classificazione dei paesi secondo i statistiche attuali per anni


Commenti: