29
/it/
it
AIzaSyAYiBZKx7MnpbEhh9jyipgxe19OcubqV5w
April 1, 2024
249130
Sri Lanka
LKA
true
2
1
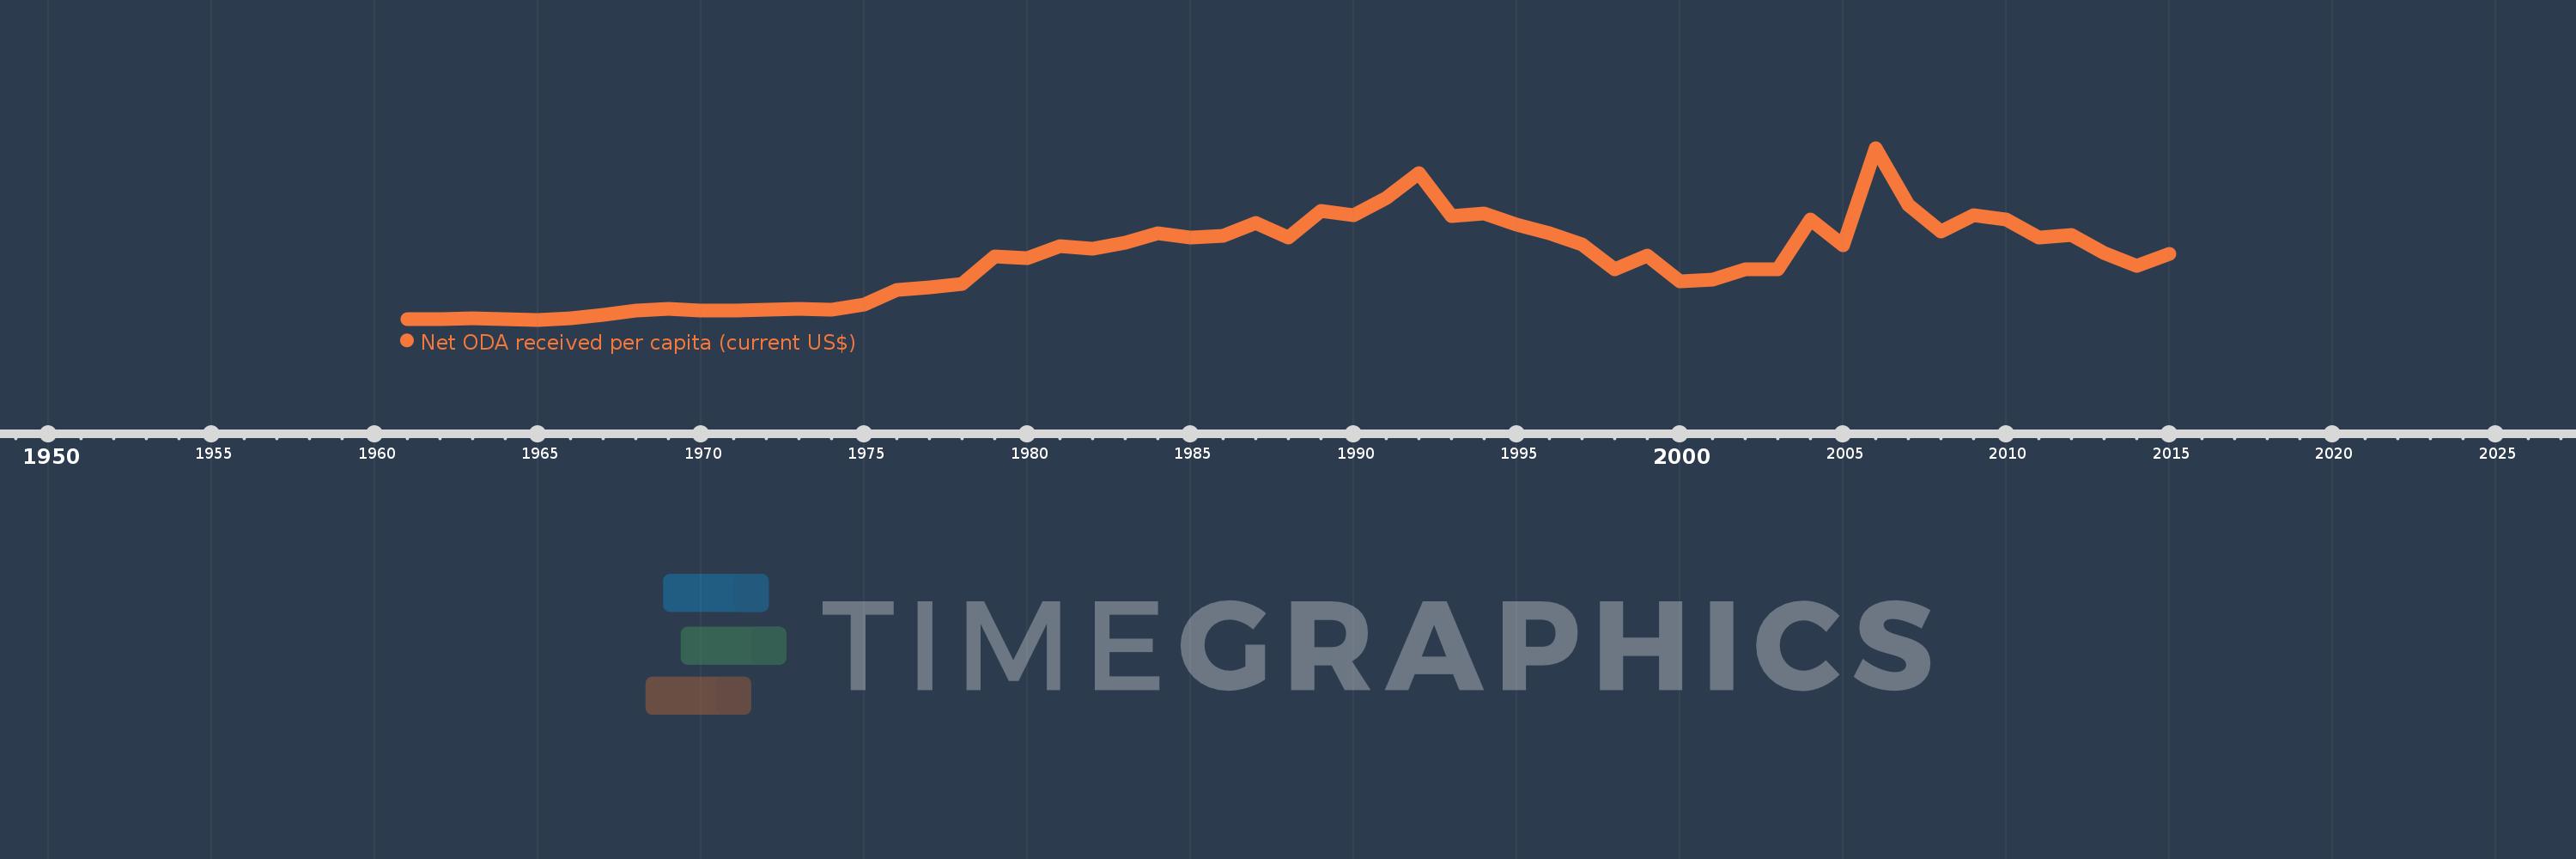
Net ODA received per capita (current US$)
2015,2014,2013,2012,2011,2010,2009,2008,2007,2006,2005,2004,2003,2002,2001,2000,1999,1998,1997,1996,1995,1994,1993,1992,1991,1990,1989,1988,1987,1986,1985,1984,1983,1982,1981,1980,1979,1978,1977,1976,1975,1974,1973,1972,1971,1970,1969,1968,1967,1966,1965,1964,1963,1962,1961
Queste statistiche in altri paesi:
AfghanistanAlbaniaAlgeriaAngolaAntigua and BarbudaArab WorldArgentinaArmeniaArubaAzerbaijanBahamas, TheBahrainBangladeshBarbadosBelarusBelizeBeninBermudaBhutanBoliviaBosnia and HerzegovinaBotswanaBrazilBritish Virgin IslandsBrunei DarussalamBurkina FasoBurundiCabo VerdeCambodiaCameroonCaribbean small statesCayman IslandsCentral African RepublicCentral Europe and the BalticsChadChileChinaColombiaComorosCongo, Dem. Rep.Congo, Rep.Costa RicaCote d'IvoireCroatiaCubaCyprusDjiboutiDominicaDominican RepublicEast Asia & PacificEast Asia & Pacific (excluding high income)East Asia & Pacific (IDA & IBRD countries)EcuadorEgypt, Arab Rep.El SalvadorEquatorial GuineaEritreaEthiopiaEuro areaEurope & Central AsiaEurope & Central Asia (excluding high income)Europe & Central Asia (IDA & IBRD countries)European UnionFijiFragile and conflict affected situationsFrench PolynesiaGabonGambia, TheGeorgiaGhanaGibraltarGrenadaGuatemalaGuineaGuinea-BissauGuyanaHaitiHeavily indebted poor countries (HIPC)High incomeHondurasHong Kong SAR, ChinaIBRD onlyIDA & IBRD totalIDA blendIDA onlyIDA totalIndiaIndonesiaIran, Islamic Rep.IraqIsraelJamaicaJordanKazakhstanKenyaKiribatiKorea, Dem. People’s Rep.Korea, Rep.KosovoKuwaitKyrgyz RepublicLao PDRLatin America & Caribbean Latin America & Caribbean (excluding high income)Latin America & the Caribbean (IDA & IBRD countries)Least developed countries: UN classificationLebanonLesothoLiberiaLibyaLow & middle incomeLow incomeLower middle incomeMacao SAR, ChinaMacedonia, FYRMadagascarMalawiMalaysiaMaldivesMaliMaltaMarshall IslandsMauritaniaMauritiusMexicoMicronesia, Fed. Sts.Middle East & North AfricaMiddle East & North Africa (excluding high income)Middle East & North Africa (IDA & IBRD countries)Middle incomeMoldovaMongoliaMontenegroMoroccoMozambiqueMyanmarNamibiaNauruNepalNew CaledoniaNicaraguaNigerNigeriaNorth AmericaNorthern Mariana IslandsOECD membersOmanOther small statesPacific island small statesPakistanPalauPanamaPapua New GuineaParaguayPeruPhilippinesQatarRwandaSamoaSao Tome and PrincipeSaudi ArabiaSenegalSerbiaSeychellesSierra LeoneSingaporeSloveniaSmall statesSolomon IslandsSomaliaSouth AfricaSouth AsiaSouth Asia (IDA & IBRD)South SudanSri LankaSt. Kitts and NevisSt. LuciaSt. Vincent and the GrenadinesSub-Saharan Africa Sub-Saharan Africa (excluding high income)Sub-Saharan Africa (IDA & IBRD countries)SudanSurinameSwazilandSyrian Arab RepublicTajikistanTanzaniaThailandTimor-LesteTogoTongaTrinidad and TobagoTunisiaTurkeyTurkmenistanTurks and Caicos IslandsTuvaluUgandaUkraineUnited Arab EmiratesUpper middle incomeUruguayUzbekistanVanuatuVenezuela, RBVietnamWest Bank and GazaWorldYemen, Rep.ZambiaZimbabwe Linea del tempo:
Questa scala temporale mostra un grafico dal 1961 anno al 2015 anno. Sri Lanka. I dati fino ad 1960 anno non disponibili. Il numero di osservazioni attuali secondo i date: 55.
La fonte (nome):
Indicatori dello sviluppo mondiale
La fonte (organizzazione):
Development Assistance Committee of the Organisation for Economic Co-operation and Development, Geographical Distribution of Financial Flows to Developing Countries, Development Co-operation Report, and International Development Statistics database. Data are available online at: www.oecd.org/dac/stats/idsonline. World Bank population estimates are used for the denominator.
Categorie:
Aid Effectiveness, Economy & Growth, External Debt
sono stati aggiornati
23 apr 2017 anni
Indicatori delle variazioni dei valori per anni
Minima:
0.814
1 gen 1965 anni
Massimo:
59.939
1 gen 2006 anni
Alla data di osservazione
Valore
Variazione assoluta
La variazione rispetto al valore precedente
1 gen 1961 anni
1.121
+1.121
0.0%
1 gen 1962 anni
1.104
-0.016
-1.45%
1 gen 1963 anni
1.253
+0.148
13.41%
1 gen 1964 anni
1.02
-0.233
-18.59%
1 gen 1965 anni
0.814
-0.205
-20.12%
1 gen 1966 anni
1.339
+0.525
64.42%
1 gen 1967 anni
2.538
+1.199
89.51%
1 gen 1968 anni
3.914
+1.377
54.24%
1 gen 1969 anni
4.505
+0.59
15.08%
1 gen 1970 anni
4.07
-0.435
-9.66%
1 gen 1971 anni
3.927
-0.143
-3.51%
1 gen 1972 anni
4.391
+0.464
11.82%
1 gen 1973 anni
4.496
+0.105
2.39%
1 gen 1974 anni
4.396
-0.1
-2.22%
1 gen 1975 anni
6.002
+1.606
36.53%
1 gen 1976 anni
10.93
+4.928
82.11%
1 gen 1977 anni
12.0
+1.071
9.79%
1 gen 1978 anni
13.219
+1.219
10.15%
1 gen 1979 anni
22.684
+9.465
71.6%
1 gen 1980 anni
22.033
-0.651
-2.87%
1 gen 1981 anni
26.237
+4.204
19.08%
1 gen 1982 anni
25.249
-0.988
-3.77%
1 gen 1983 anni
27.436
+2.188
8.66%
1 gen 1984 anni
30.581
+3.144
11.46%
1 gen 1985 anni
29.172
-1.409
-4.61%
1 gen 1986 anni
29.579
+0.406
1.39%
1 gen 1987 anni
33.996
+4.417
14.93%
1 gen 1988 anni
29.136
-4.86
-14.3%
1 gen 1989 anni
38.173
+9.038
31.02%
1 gen 1990 anni
36.685
-1.488
-3.9%
1 gen 1991 anni
42.648
+5.963
16.25%
1 gen 1992 anni
51.374
+8.726
20.46%
1 gen 1993 anni
36.499
-14.875
-28.95%
1 gen 1994 anni
37.458
+0.959
2.63%
1 gen 1995 anni
33.545
-3.913
-10.45%
1 gen 1996 anni
30.641
-2.904
-8.66%
1 gen 1997 anni
26.705
-3.936
-12.84%
1 gen 1998 anni
18.053
-8.652
-32.4%
1 gen 1999 anni
23.028
+4.975
27.56%
1 gen 2000 anni
14.137
-8.892
-38.61%
1 gen 2001 anni
14.753
+0.617
4.36%
1 gen 2002 anni
18.16
+3.407
23.09%
1 gen 2003 anni
18.121
-0.038
-0.21%
1 gen 2004 anni
35.202
+17.081
94.26%
1 gen 2005 anni
26.337
-8.865
-25.18%
1 gen 2006 anni
59.939
+33.602
127.58%
1 gen 2007 anni
40.288
-19.651
-32.78%
1 gen 2008 anni
31.258
-9.03
-22.41%
1 gen 2009 anni
36.899
+5.641
18.05%
1 gen 2010 anni
35.184
-1.716
-4.65%
1 gen 2011 anni
28.962
-6.222
-17.68%
1 gen 2012 anni
30.085
+1.123
3.88%
1 gen 2013 anni
23.924
-6.161
-20.48%
1 gen 2014 anni
19.493
-4.431
-18.52%
1 gen 2015 anni
23.503
+4.011
20.58%
Classificazione dei paesi secondo i statistiche attuali per anni


Commenti: