29
/it/
it
AIzaSyAYiBZKx7MnpbEhh9jyipgxe19OcubqV5w
April 1, 2024
82756
Belize
BLZ
true
2
1
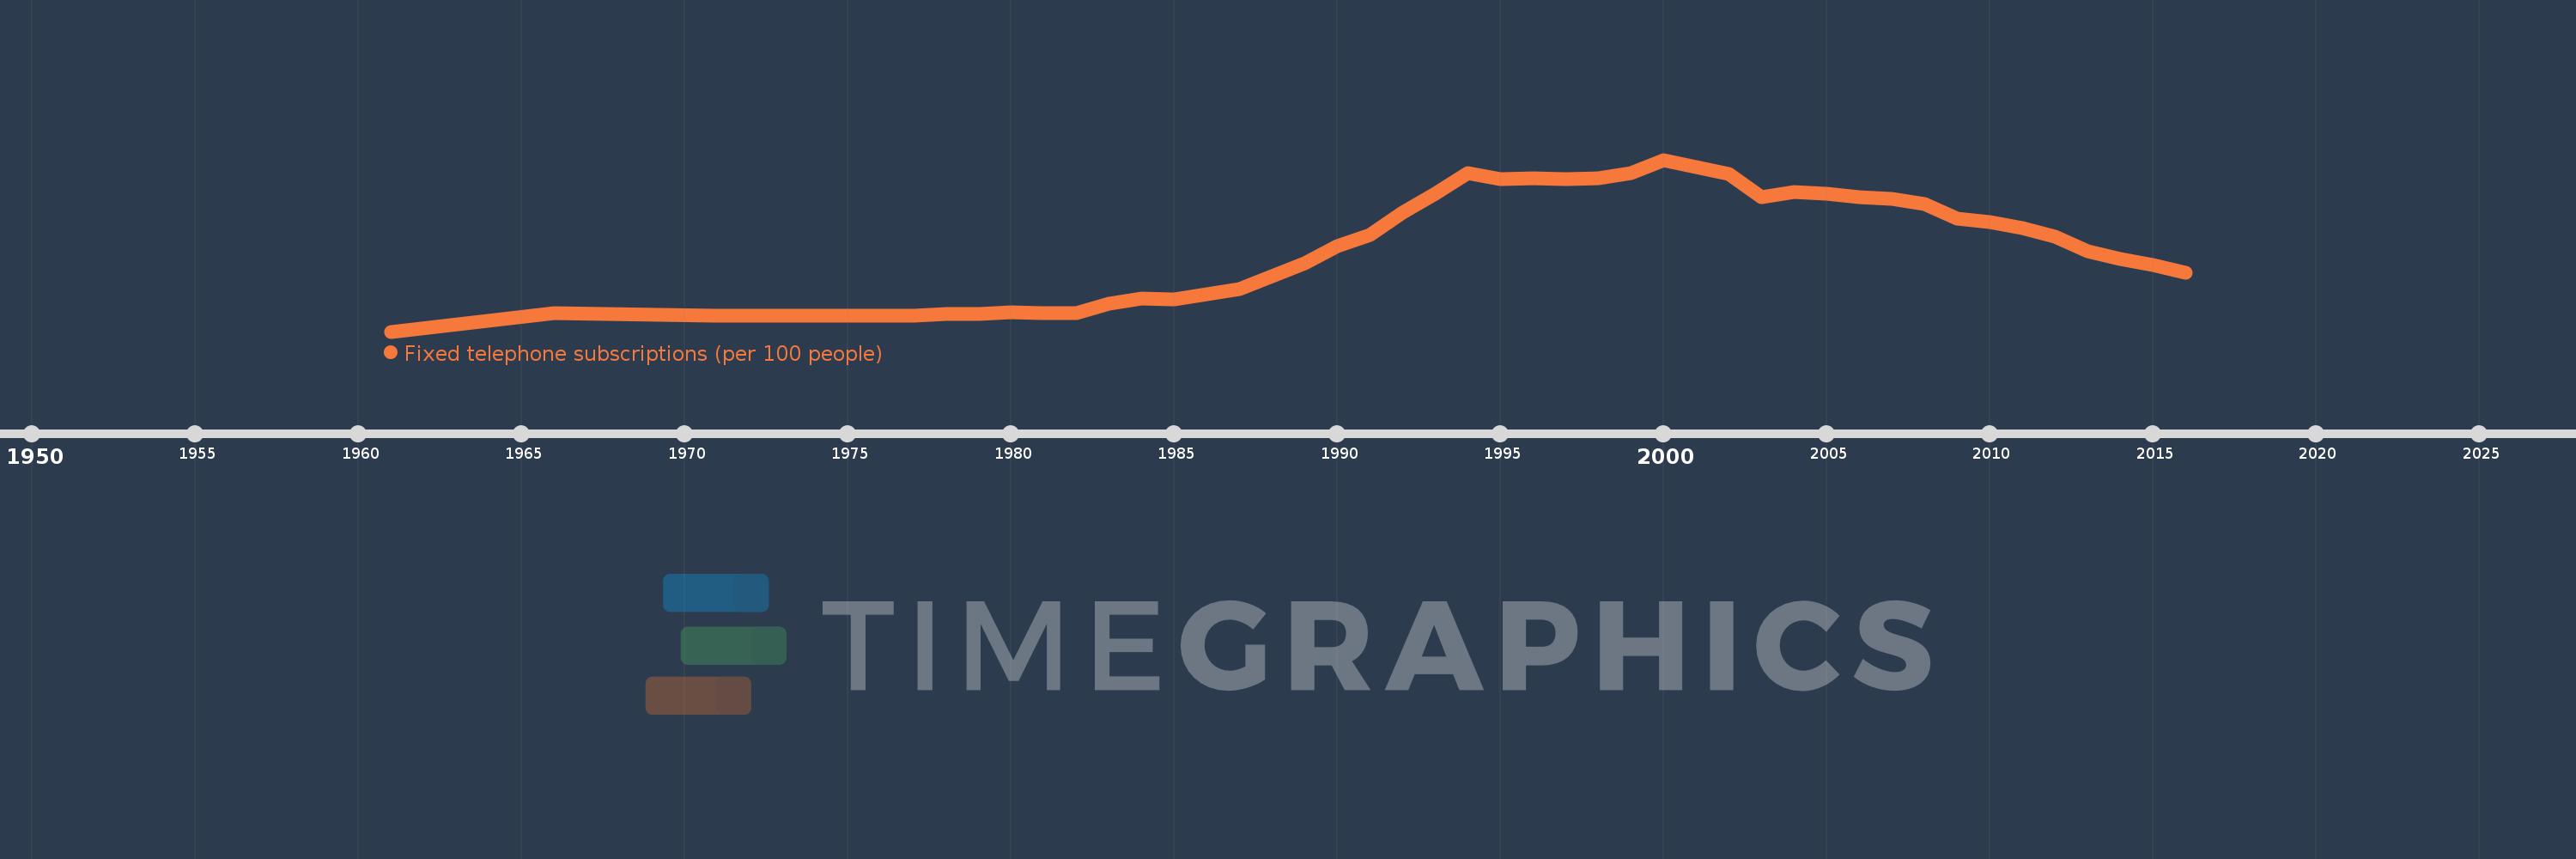
Fixed telephone subscriptions (per 100 people)
2016,2015,2014,2013,2012,2011,2010,2009,2008,2007,2006,2005,2004,2003,2002,2001,2000,1999,1998,1997,1996,1995,1994,1993,1992,1991,1990,1989,1988,1987,1986,1985,1984,1983,1982,1981,1980,1979,1978,1977,1976,1971,1966,1961
Queste statistiche in altri paesi:
AfghanistanAlbaniaAlgeriaAmerican SamoaAndorraAngolaAntigua and BarbudaArab WorldArgentinaArmeniaArubaAustraliaAustriaAzerbaijanBahamas, TheBahrainBangladeshBarbadosBelarusBelgiumBelizeBeninBermudaBhutanBoliviaBosnia and HerzegovinaBotswanaBrazilBritish Virgin IslandsBrunei DarussalamBulgariaBurkina FasoBurundiCabo VerdeCambodiaCameroonCanadaCaribbean small statesCayman IslandsCentral African RepublicCentral Europe and the BalticsChadChileChinaColombiaComorosCongo, Dem. Rep.Congo, Rep.Costa RicaCote d'IvoireCroatiaCubaCuracaoCyprusCzech RepublicDenmarkDjiboutiDominicaDominican RepublicEarly-demographic dividendEast Asia & PacificEast Asia & Pacific (excluding high income)East Asia & Pacific (IDA & IBRD countries)EcuadorEgypt, Arab Rep.El SalvadorEquatorial GuineaEritreaEstoniaEthiopiaEuro areaEurope & Central AsiaEurope & Central Asia (excluding high income)Europe & Central Asia (IDA & IBRD countries)European UnionFaroe IslandsFijiFinlandFragile and conflict affected situationsFranceFrench PolynesiaGabonGambia, TheGeorgiaGermanyGhanaGibraltarGreeceGreenlandGrenadaGuamGuatemalaGuineaGuinea-BissauGuyanaHaitiHeavily indebted poor countries (HIPC)High incomeHondurasHong Kong SAR, ChinaHungaryIBRD onlyIcelandIDA & IBRD totalIDA blendIDA onlyIDA totalIndiaIndonesiaIran, Islamic Rep.IraqIrelandIsraelItalyJamaicaJapanJordanKazakhstanKenyaKiribatiKorea, Dem. People’s Rep.Korea, Rep.KosovoKuwaitKyrgyz RepublicLao PDRLate-demographic dividendLatin America & Caribbean Latin America & Caribbean (excluding high income)Latin America & the Caribbean (IDA & IBRD countries)LatviaLeast developed countries: UN classificationLebanonLesothoLiberiaLibyaLiechtensteinLithuaniaLow & middle incomeLow incomeLower middle incomeLuxembourgMacao SAR, ChinaMacedonia, FYRMadagascarMalawiMalaysiaMaldivesMaliMaltaMarshall IslandsMauritaniaMauritiusMexicoMicronesia, Fed. Sts.Middle East & North AfricaMiddle East & North Africa (excluding high income)Middle East & North Africa (IDA & IBRD countries)Middle incomeMoldovaMonacoMongoliaMontenegroMoroccoMozambiqueMyanmarNamibiaNauruNepalNetherlandsNew CaledoniaNew ZealandNicaraguaNigerNigeriaNorth AmericaNorthern Mariana IslandsNorwayOECD membersOmanOther small statesPacific island small statesPakistanPalauPanamaPapua New GuineaParaguayPeruPhilippinesPolandPortugalPost-demographic dividendPre-demographic dividendPuerto RicoQatarRomaniaRussian FederationRwandaSamoaSan MarinoSao Tome and PrincipeSaudi ArabiaSenegalSerbiaSeychellesSierra LeoneSingaporeSlovak RepublicSloveniaSmall statesSolomon IslandsSomaliaSouth AfricaSouth AsiaSouth Asia (IDA & IBRD)South SudanSpainSri LankaSt. Kitts and NevisSt. LuciaSt. Vincent and the GrenadinesSub-Saharan Africa Sub-Saharan Africa (excluding high income)Sub-Saharan Africa (IDA & IBRD countries)SudanSurinameSwazilandSwedenSwitzerlandSyrian Arab RepublicTajikistanTanzaniaThailandTimor-LesteTogoTongaTrinidad and TobagoTunisiaTurkeyTurkmenistanTurks and Caicos IslandsTuvaluUgandaUkraineUnited Arab EmiratesUnited KingdomUnited StatesUpper middle incomeUruguayUzbekistanVanuatuVenezuela, RBVietnamVirgin Islands (U.S.)West Bank and GazaWorldYemen, Rep.ZambiaZimbabwe Linea del tempo:
Questa scala temporale mostra un grafico dal 1961 anno al 2016 anno. Belize. I dati fino ad 1960 anno non disponibili. Il numero di osservazioni attuali secondo i date: 44.
La fonte (nome):
Indicatori dello sviluppo mondiale
La fonte (organizzazione):
International Telecommunication Union, World Telecommunication/ICT Development Report and database.
Categorie:
Infrastructure
sono stati aggiornati
23 apr 2017 anni
Indicatori delle variazioni dei valori per anni
Minima:
1.106
1 gen 1961 anni
Massimo:
15.577
1 gen 2000 anni
Alla data di osservazione
Valore
Variazione assoluta
La variazione rispetto al valore precedente
1 gen 1961 anni
1.106
+1.106
0.0%
1 gen 1966 anni
2.638
+1.533
138.63%
1 gen 1971 anni
2.455
-0.183
-6.94%
1 gen 1976 anni
2.476
+0.021
0.85%
1 gen 1977 anni
2.475
-0.001
-0.05%
1 gen 1978 anni
2.568
+0.093
3.75%
1 gen 1979 anni
2.582
+0.014
0.54%
1 gen 1980 anni
2.725
+0.143
5.56%
1 gen 1981 anni
2.685
-0.041
-1.49%
1 gen 1982 anni
2.642
-0.043
-1.61%
1 gen 1983 anni
3.452
+0.81
30.66%
1 gen 1984 anni
3.876
+0.424
12.29%
1 gen 1985 anni
3.791
-0.084
-2.18%
1 gen 1986 anni
4.245
+0.453
11.96%
1 gen 1987 anni
4.718
+0.474
11.16%
1 gen 1988 anni
5.739
+1.02
21.63%
1 gen 1989 anni
6.847
+1.108
19.31%
1 gen 1990 anni
8.319
+1.472
21.49%
1 gen 1991 anni
9.235
+0.916
11.01%
1 gen 1992 anni
11.118
+1.883
20.39%
1 gen 1993 anni
12.745
+1.628
14.64%
1 gen 1994 anni
14.426
+1.681
13.19%
1 gen 1995 anni
13.932
-0.494
-3.42%
1 gen 1996 anni
13.987
+0.054
0.39%
1 gen 1997 anni
13.938
-0.049
-0.35%
1 gen 1998 anni
14.036
+0.099
0.71%
1 gen 1999 anni
14.433
+0.397
2.83%
1 gen 2000 anni
15.577
+1.143
7.92%
1 gen 2001 anni
14.986
-0.591
-3.79%
1 gen 2002 anni
14.371
-0.615
-4.1%
1 gen 2003 anni
12.432
-1.939
-13.49%
1 gen 2004 anni
12.881
+0.449
3.61%
1 gen 2005 anni
12.721
-0.16
-1.24%
1 gen 2006 anni
12.419
-0.302
-2.37%
1 gen 2007 anni
12.304
-0.116
-0.93%
1 gen 2008 anni
11.847
-0.457
-3.71%
1 gen 2009 anni
10.603
-1.244
-10.5%
1 gen 2010 anni
10.354
-0.249
-2.34%
1 gen 2011 anni
9.815
-0.539
-5.21%
1 gen 2012 anni
9.12
-0.695
-7.08%
1 gen 2013 anni
7.843
-1.277
-14.0%
1 gen 2014 anni
7.246
-0.596
-7.6%
1 gen 2015 anni
6.681
-0.565
-7.8%
1 gen 2016 anni
6.041
-0.64
-9.58%
Classificazione dei paesi secondo i statistiche attuali per anni


Commenti: