29
/it/
it
AIzaSyAYiBZKx7MnpbEhh9jyipgxe19OcubqV5w
April 1, 2024
180573
Liechtenstein
LIE
true
2
1
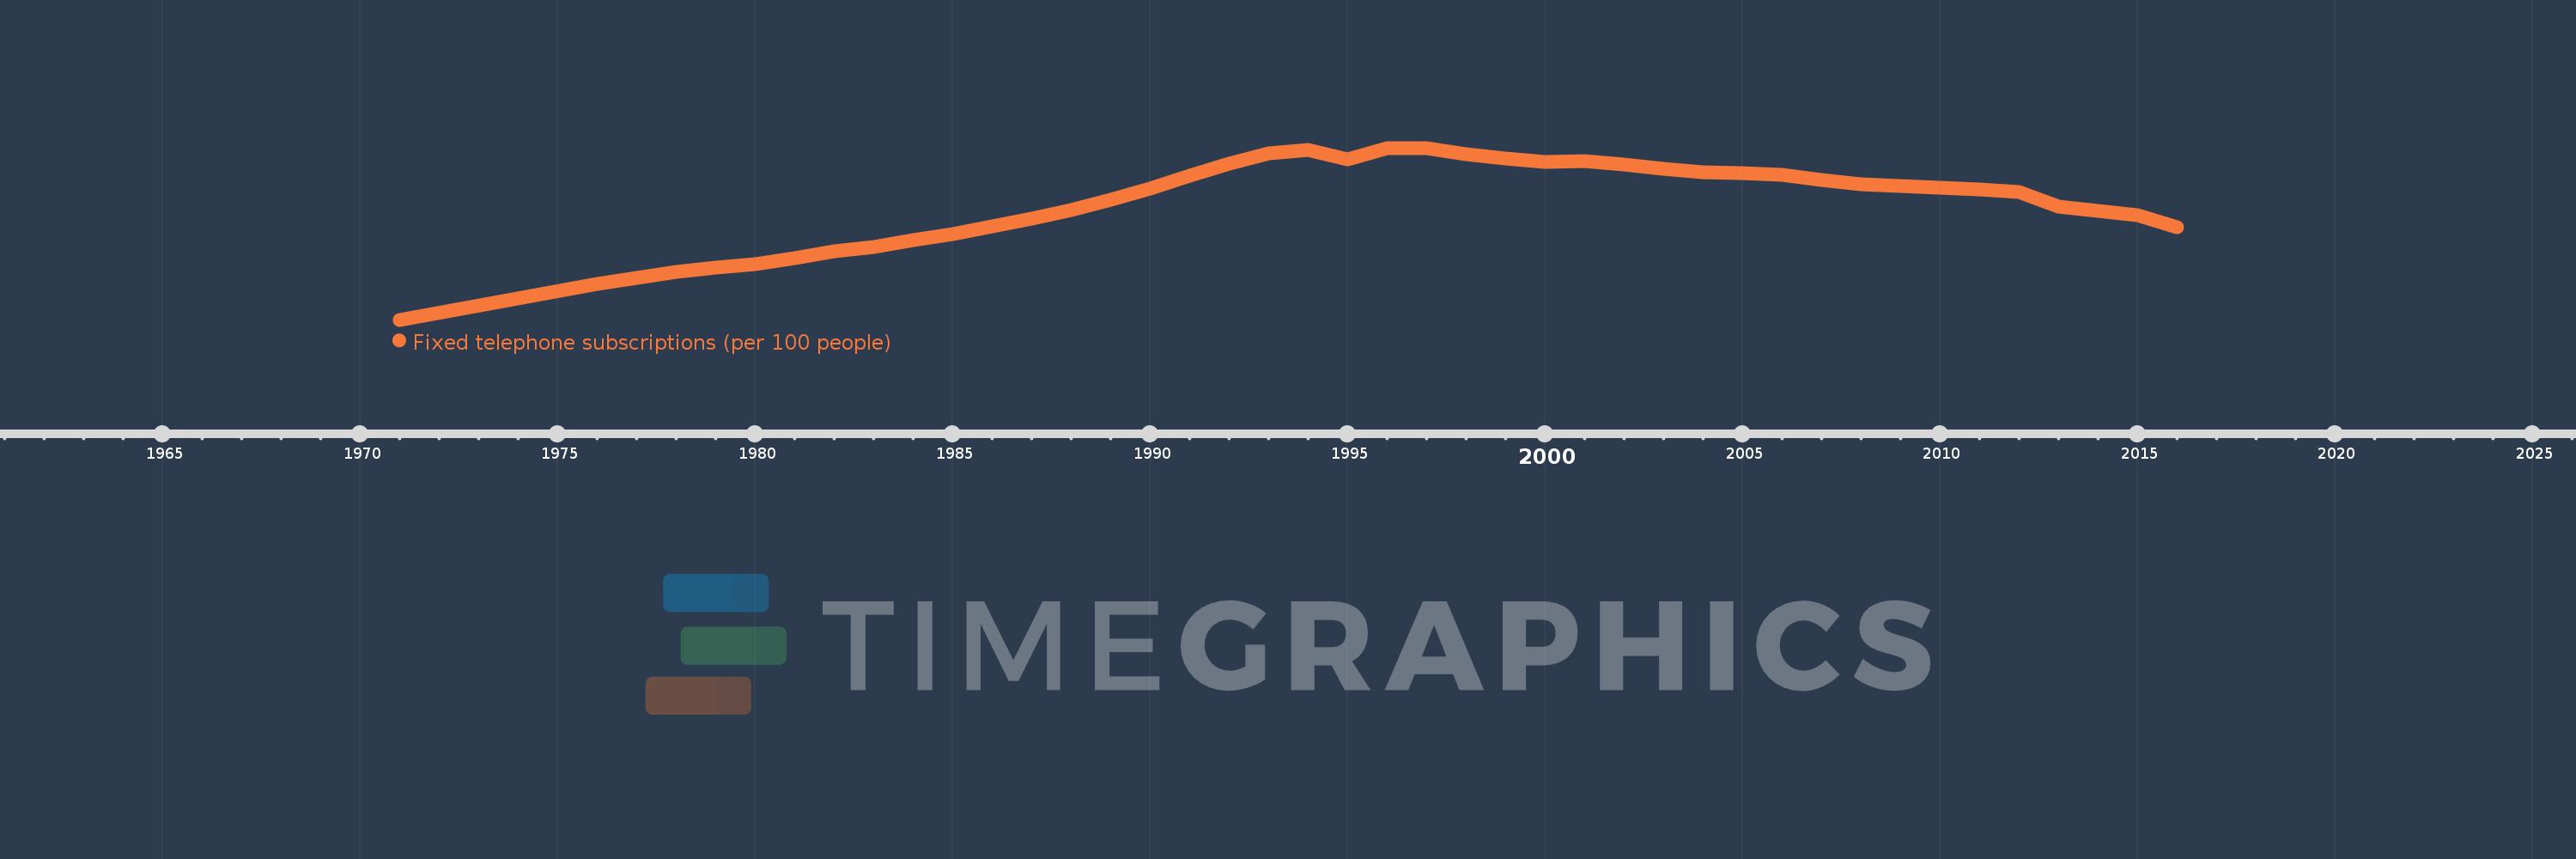
Fixed telephone subscriptions (per 100 people)
2016,2015,2014,2013,2012,2011,2010,2009,2008,2007,2006,2005,2004,2003,2002,2001,2000,1999,1998,1997,1996,1995,1994,1993,1992,1991,1990,1989,1988,1987,1986,1985,1984,1983,1982,1981,1980,1979,1978,1977,1976,1971
Queste statistiche in altri paesi:
AfghanistanAlbaniaAlgeriaAmerican SamoaAndorraAngolaAntigua and BarbudaArab WorldArgentinaArmeniaArubaAustraliaAustriaAzerbaijanBahamas, TheBahrainBangladeshBarbadosBelarusBelgiumBelizeBeninBermudaBhutanBoliviaBosnia and HerzegovinaBotswanaBrazilBritish Virgin IslandsBrunei DarussalamBulgariaBurkina FasoBurundiCabo VerdeCambodiaCameroonCanadaCaribbean small statesCayman IslandsCentral African RepublicCentral Europe and the BalticsChadChileChinaColombiaComorosCongo, Dem. Rep.Congo, Rep.Costa RicaCote d'IvoireCroatiaCubaCuracaoCyprusCzech RepublicDenmarkDjiboutiDominicaDominican RepublicEarly-demographic dividendEast Asia & PacificEast Asia & Pacific (excluding high income)East Asia & Pacific (IDA & IBRD countries)EcuadorEgypt, Arab Rep.El SalvadorEquatorial GuineaEritreaEstoniaEthiopiaEuro areaEurope & Central AsiaEurope & Central Asia (excluding high income)Europe & Central Asia (IDA & IBRD countries)European UnionFaroe IslandsFijiFinlandFragile and conflict affected situationsFranceFrench PolynesiaGabonGambia, TheGeorgiaGermanyGhanaGibraltarGreeceGreenlandGrenadaGuamGuatemalaGuineaGuinea-BissauGuyanaHaitiHeavily indebted poor countries (HIPC)High incomeHondurasHong Kong SAR, ChinaHungaryIBRD onlyIcelandIDA & IBRD totalIDA blendIDA onlyIDA totalIndiaIndonesiaIran, Islamic Rep.IraqIrelandIsraelItalyJamaicaJapanJordanKazakhstanKenyaKiribatiKorea, Dem. People’s Rep.Korea, Rep.KosovoKuwaitKyrgyz RepublicLao PDRLate-demographic dividendLatin America & Caribbean Latin America & Caribbean (excluding high income)Latin America & the Caribbean (IDA & IBRD countries)LatviaLeast developed countries: UN classificationLebanonLesothoLiberiaLibyaLiechtensteinLithuaniaLow & middle incomeLow incomeLower middle incomeLuxembourgMacao SAR, ChinaMacedonia, FYRMadagascarMalawiMalaysiaMaldivesMaliMaltaMarshall IslandsMauritaniaMauritiusMexicoMicronesia, Fed. Sts.Middle East & North AfricaMiddle East & North Africa (excluding high income)Middle East & North Africa (IDA & IBRD countries)Middle incomeMoldovaMonacoMongoliaMontenegroMoroccoMozambiqueMyanmarNamibiaNauruNepalNetherlandsNew CaledoniaNew ZealandNicaraguaNigerNigeriaNorth AmericaNorthern Mariana IslandsNorwayOECD membersOmanOther small statesPacific island small statesPakistanPalauPanamaPapua New GuineaParaguayPeruPhilippinesPolandPortugalPost-demographic dividendPre-demographic dividendPuerto RicoQatarRomaniaRussian FederationRwandaSamoaSan MarinoSao Tome and PrincipeSaudi ArabiaSenegalSerbiaSeychellesSierra LeoneSingaporeSlovak RepublicSloveniaSmall statesSolomon IslandsSomaliaSouth AfricaSouth AsiaSouth Asia (IDA & IBRD)South SudanSpainSri LankaSt. Kitts and NevisSt. LuciaSt. Vincent and the GrenadinesSub-Saharan Africa Sub-Saharan Africa (excluding high income)Sub-Saharan Africa (IDA & IBRD countries)SudanSurinameSwazilandSwedenSwitzerlandSyrian Arab RepublicTajikistanTanzaniaThailandTimor-LesteTogoTongaTrinidad and TobagoTunisiaTurkeyTurkmenistanTurks and Caicos IslandsTuvaluUgandaUkraineUnited Arab EmiratesUnited KingdomUnited StatesUpper middle incomeUruguayUzbekistanVanuatuVenezuela, RBVietnamVirgin Islands (U.S.)West Bank and GazaWorldYemen, Rep.ZambiaZimbabwe Linea del tempo:
Questa scala temporale mostra un grafico dal 1971 anno al 2016 anno. Liechtenstein. I dati fino ad 1970 anno non disponibili. Il numero di osservazioni attuali secondo i date: 42.
La fonte (nome):
Indicatori dello sviluppo mondiale
La fonte (organizzazione):
International Telecommunication Union, World Telecommunication/ICT Development Report and database.
Categorie:
Infrastructure
sono stati aggiornati
23 apr 2017 anni
Indicatori delle variazioni dei valori per anni
Minima:
25.012
1 gen 1971 anni
Massimo:
63.691
1 gen 1996 anni
Alla data di osservazione
Valore
Variazione assoluta
La variazione rispetto al valore precedente
1 gen 1971 anni
25.012
+25.012
0.0%
1 gen 1976 anni
33.019
+8.007
32.01%
1 gen 1977 anni
34.465
+1.446
4.38%
1 gen 1978 anni
35.694
+1.229
3.57%
1 gen 1979 anni
36.686
+0.992
2.78%
1 gen 1980 anni
37.482
+0.796
2.17%
1 gen 1981 anni
38.803
+1.321
3.53%
1 gen 1982 anni
40.426
+1.622
4.18%
1 gen 1983 anni
41.435
+1.009
2.5%
1 gen 1984 anni
42.887
+1.452
3.51%
1 gen 1985 anni
44.278
+1.391
3.24%
1 gen 1986 anni
45.988
+1.711
3.86%
1 gen 1987 anni
47.8
+1.812
3.94%
1 gen 1988 anni
49.689
+1.889
3.95%
1 gen 1989 anni
52.02
+2.332
4.69%
1 gen 1990 anni
54.633
+2.613
5.02%
1 gen 1991 anni
57.533
+2.9
5.31%
1 gen 1992 anni
60.105
+2.572
4.47%
1 gen 1993 anni
62.534
+2.429
4.04%
1 gen 1994 anni
63.192
+0.658
1.05%
1 gen 1995 anni
61.087
-2.105
-3.33%
1 gen 1996 anni
63.691
+2.603
4.26%
1 gen 1997 anni
63.656
-0.035
-0.05%
1 gen 1998 anni
62.258
-1.398
-2.2%
1 gen 1999 anni
61.321
-0.937
-1.51%
1 gen 2000 anni
60.482
-0.84
-1.37%
1 gen 2001 anni
60.653
+0.172
0.28%
1 gen 2002 anni
60.045
-0.609
-1.0%
1 gen 2003 anni
58.907
-1.138
-1.89%
1 gen 2004 anni
58.288
-0.619
-1.05%
1 gen 2005 anni
58.008
-0.279
-0.48%
1 gen 2006 anni
57.599
-0.409
-0.71%
1 gen 2007 anni
56.398
-1.202
-2.09%
1 gen 2008 anni
55.449
-0.949
-1.68%
1 gen 2009 anni
55.084
-0.365
-0.66%
1 gen 2010 anni
54.671
-0.413
-0.75%
1 gen 2011 anni
54.264
-0.407
-0.74%
1 gen 2012 anni
53.864
-0.4
-0.74%
1 gen 2013 anni
50.387
-3.477
-6.45%
1 gen 2014 anni
49.56
-0.827
-1.64%
1 gen 2015 anni
48.511
-1.049
-2.12%
1 gen 2016 anni
45.872
-2.639
-5.44%
Classificazione dei paesi secondo i statistiche attuali per anni


Commenti: