29
/it/
it
AIzaSyAYiBZKx7MnpbEhh9jyipgxe19OcubqV5w
April 1, 2024
101062
Canada
CAN
true
2
1
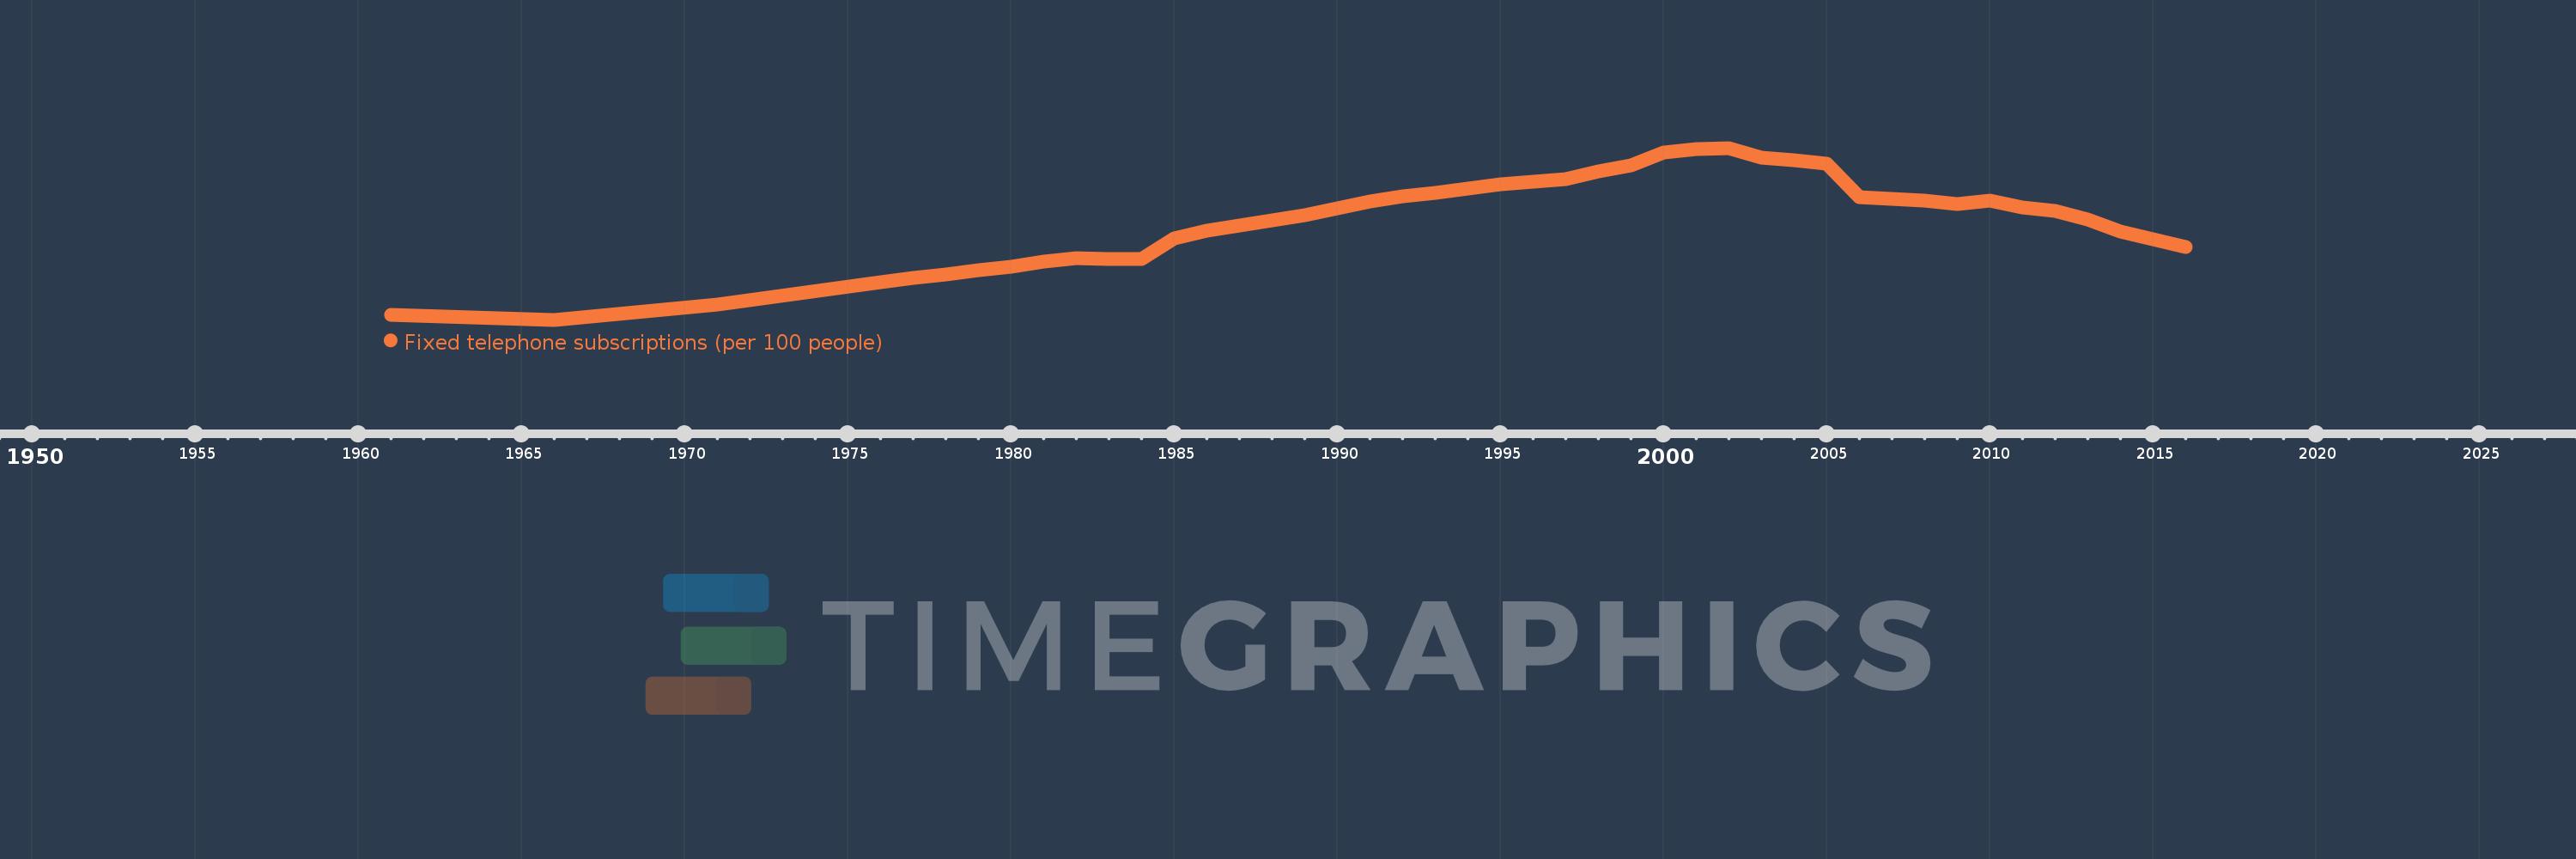
Fixed telephone subscriptions (per 100 people)
2016,2015,2014,2013,2012,2011,2010,2009,2008,2007,2006,2005,2004,2003,2002,2001,2000,1999,1998,1997,1996,1995,1994,1993,1992,1991,1990,1989,1988,1987,1986,1985,1984,1983,1982,1981,1980,1979,1978,1977,1976,1971,1966,1961
Queste statistiche in altri paesi:
AfghanistanAlbaniaAlgeriaAmerican SamoaAndorraAngolaAntigua and BarbudaArab WorldArgentinaArmeniaArubaAustraliaAustriaAzerbaijanBahamas, TheBahrainBangladeshBarbadosBelarusBelgiumBelizeBeninBermudaBhutanBoliviaBosnia and HerzegovinaBotswanaBrazilBritish Virgin IslandsBrunei DarussalamBulgariaBurkina FasoBurundiCabo VerdeCambodiaCameroonCanadaCaribbean small statesCayman IslandsCentral African RepublicCentral Europe and the BalticsChadChileChinaColombiaComorosCongo, Dem. Rep.Congo, Rep.Costa RicaCote d'IvoireCroatiaCubaCuracaoCyprusCzech RepublicDenmarkDjiboutiDominicaDominican RepublicEarly-demographic dividendEast Asia & PacificEast Asia & Pacific (excluding high income)East Asia & Pacific (IDA & IBRD countries)EcuadorEgypt, Arab Rep.El SalvadorEquatorial GuineaEritreaEstoniaEthiopiaEuro areaEurope & Central AsiaEurope & Central Asia (excluding high income)Europe & Central Asia (IDA & IBRD countries)European UnionFaroe IslandsFijiFinlandFragile and conflict affected situationsFranceFrench PolynesiaGabonGambia, TheGeorgiaGermanyGhanaGibraltarGreeceGreenlandGrenadaGuamGuatemalaGuineaGuinea-BissauGuyanaHaitiHeavily indebted poor countries (HIPC)High incomeHondurasHong Kong SAR, ChinaHungaryIBRD onlyIcelandIDA & IBRD totalIDA blendIDA onlyIDA totalIndiaIndonesiaIran, Islamic Rep.IraqIrelandIsraelItalyJamaicaJapanJordanKazakhstanKenyaKiribatiKorea, Dem. People’s Rep.Korea, Rep.KosovoKuwaitKyrgyz RepublicLao PDRLate-demographic dividendLatin America & Caribbean Latin America & Caribbean (excluding high income)Latin America & the Caribbean (IDA & IBRD countries)LatviaLeast developed countries: UN classificationLebanonLesothoLiberiaLibyaLiechtensteinLithuaniaLow & middle incomeLow incomeLower middle incomeLuxembourgMacao SAR, ChinaMacedonia, FYRMadagascarMalawiMalaysiaMaldivesMaliMaltaMarshall IslandsMauritaniaMauritiusMexicoMicronesia, Fed. Sts.Middle East & North AfricaMiddle East & North Africa (excluding high income)Middle East & North Africa (IDA & IBRD countries)Middle incomeMoldovaMonacoMongoliaMontenegroMoroccoMozambiqueMyanmarNamibiaNauruNepalNetherlandsNew CaledoniaNew ZealandNicaraguaNigerNigeriaNorth AmericaNorthern Mariana IslandsNorwayOECD membersOmanOther small statesPacific island small statesPakistanPalauPanamaPapua New GuineaParaguayPeruPhilippinesPolandPortugalPost-demographic dividendPre-demographic dividendPuerto RicoQatarRomaniaRussian FederationRwandaSamoaSan MarinoSao Tome and PrincipeSaudi ArabiaSenegalSerbiaSeychellesSierra LeoneSingaporeSlovak RepublicSloveniaSmall statesSolomon IslandsSomaliaSouth AfricaSouth AsiaSouth Asia (IDA & IBRD)South SudanSpainSri LankaSt. Kitts and NevisSt. LuciaSt. Vincent and the GrenadinesSub-Saharan Africa Sub-Saharan Africa (excluding high income)Sub-Saharan Africa (IDA & IBRD countries)SudanSurinameSwazilandSwedenSwitzerlandSyrian Arab RepublicTajikistanTanzaniaThailandTimor-LesteTogoTongaTrinidad and TobagoTunisiaTurkeyTurkmenistanTurks and Caicos IslandsTuvaluUgandaUkraineUnited Arab EmiratesUnited KingdomUnited StatesUpper middle incomeUruguayUzbekistanVanuatuVenezuela, RBVietnamVirgin Islands (U.S.)West Bank and GazaWorldYemen, Rep.ZambiaZimbabwe Linea del tempo:
Questa scala temporale mostra un grafico dal 1961 anno al 2016 anno. Canada. I dati fino ad 1960 anno non disponibili. Il numero di osservazioni attuali secondo i date: 44.
La fonte (nome):
Indicatori dello sviluppo mondiale
La fonte (organizzazione):
International Telecommunication Union, World Telecommunication/ICT Development Report and database.
Categorie:
Infrastructure
sono stati aggiornati
23 apr 2017 anni
Indicatori delle variazioni dei valori per anni
Minima:
26.762
1 gen 1966 anni
Massimo:
68.177
1 gen 2002 anni
Alla data di osservazione
Valore
Variazione assoluta
La variazione rispetto al valore precedente
1 gen 1961 anni
27.849
+27.849
0.0%
1 gen 1966 anni
26.762
-1.087
-3.9%
1 gen 1971 anni
30.39
+3.629
13.56%
1 gen 1976 anni
35.78
+5.39
17.73%
1 gen 1977 anni
36.757
+0.977
2.73%
1 gen 1978 anni
37.607
+0.85
2.31%
1 gen 1979 anni
38.645
+1.038
2.76%
1 gen 1980 anni
39.562
+0.917
2.37%
1 gen 1981 anni
40.712
+1.15
2.91%
1 gen 1982 anni
41.571
+0.859
2.11%
1 gen 1983 anni
41.321
-0.25
-0.6%
1 gen 1984 anni
41.429
+0.109
0.26%
1 gen 1985 anni
46.305
+4.876
11.77%
1 gen 1986 anni
48.293
+1.988
4.29%
1 gen 1987 anni
49.464
+1.171
2.42%
1 gen 1988 anni
50.662
+1.198
2.42%
1 gen 1989 anni
51.927
+1.265
2.5%
1 gen 1990 anni
53.671
+1.744
3.36%
1 gen 1991 anni
55.304
+1.633
3.04%
1 gen 1992 anni
56.463
+1.159
2.1%
1 gen 1993 anni
57.309
+0.846
1.5%
1 gen 1994 anni
58.295
+0.986
1.72%
1 gen 1995 anni
59.502
+1.207
2.07%
1 gen 1996 anni
59.966
+0.464
0.78%
1 gen 1997 anni
60.751
+0.785
1.31%
1 gen 1998 anni
62.478
+1.727
2.84%
1 gen 1999 anni
64.013
+1.535
2.46%
1 gen 2000 anni
67.005
+2.992
4.67%
1 gen 2001 anni
67.888
+0.883
1.32%
1 gen 2002 anni
68.177
+0.289
0.43%
1 gen 2003 anni
65.919
-2.258
-3.31%
1 gen 2004 anni
65.245
-0.674
-1.02%
1 gen 2005 anni
64.432
-0.813
-1.25%
1 gen 2006 anni
56.267
-8.165
-12.67%
1 gen 2007 anni
55.92
-0.348
-0.62%
1 gen 2008 anni
55.424
-0.496
-0.89%
1 gen 2009 anni
54.69
-0.734
-1.32%
1 gen 2010 anni
55.427
+0.737
1.35%
1 gen 2011 anni
53.9
-1.527
-2.75%
1 gen 2012 anni
52.987
-0.912
-1.69%
1 gen 2013 anni
50.881
-2.106
-3.97%
1 gen 2014 anni
48.096
-2.785
-5.47%
1 gen 2015 anni
46.175
-1.921
-3.99%
1 gen 2016 anni
44.331
-1.844
-3.99%
Classificazione dei paesi secondo i statistiche attuali per anni


Commenti: