29
/it/
it
AIzaSyAYiBZKx7MnpbEhh9jyipgxe19OcubqV5w
April 1, 2024
191378
Malta
MLT
true
2
1
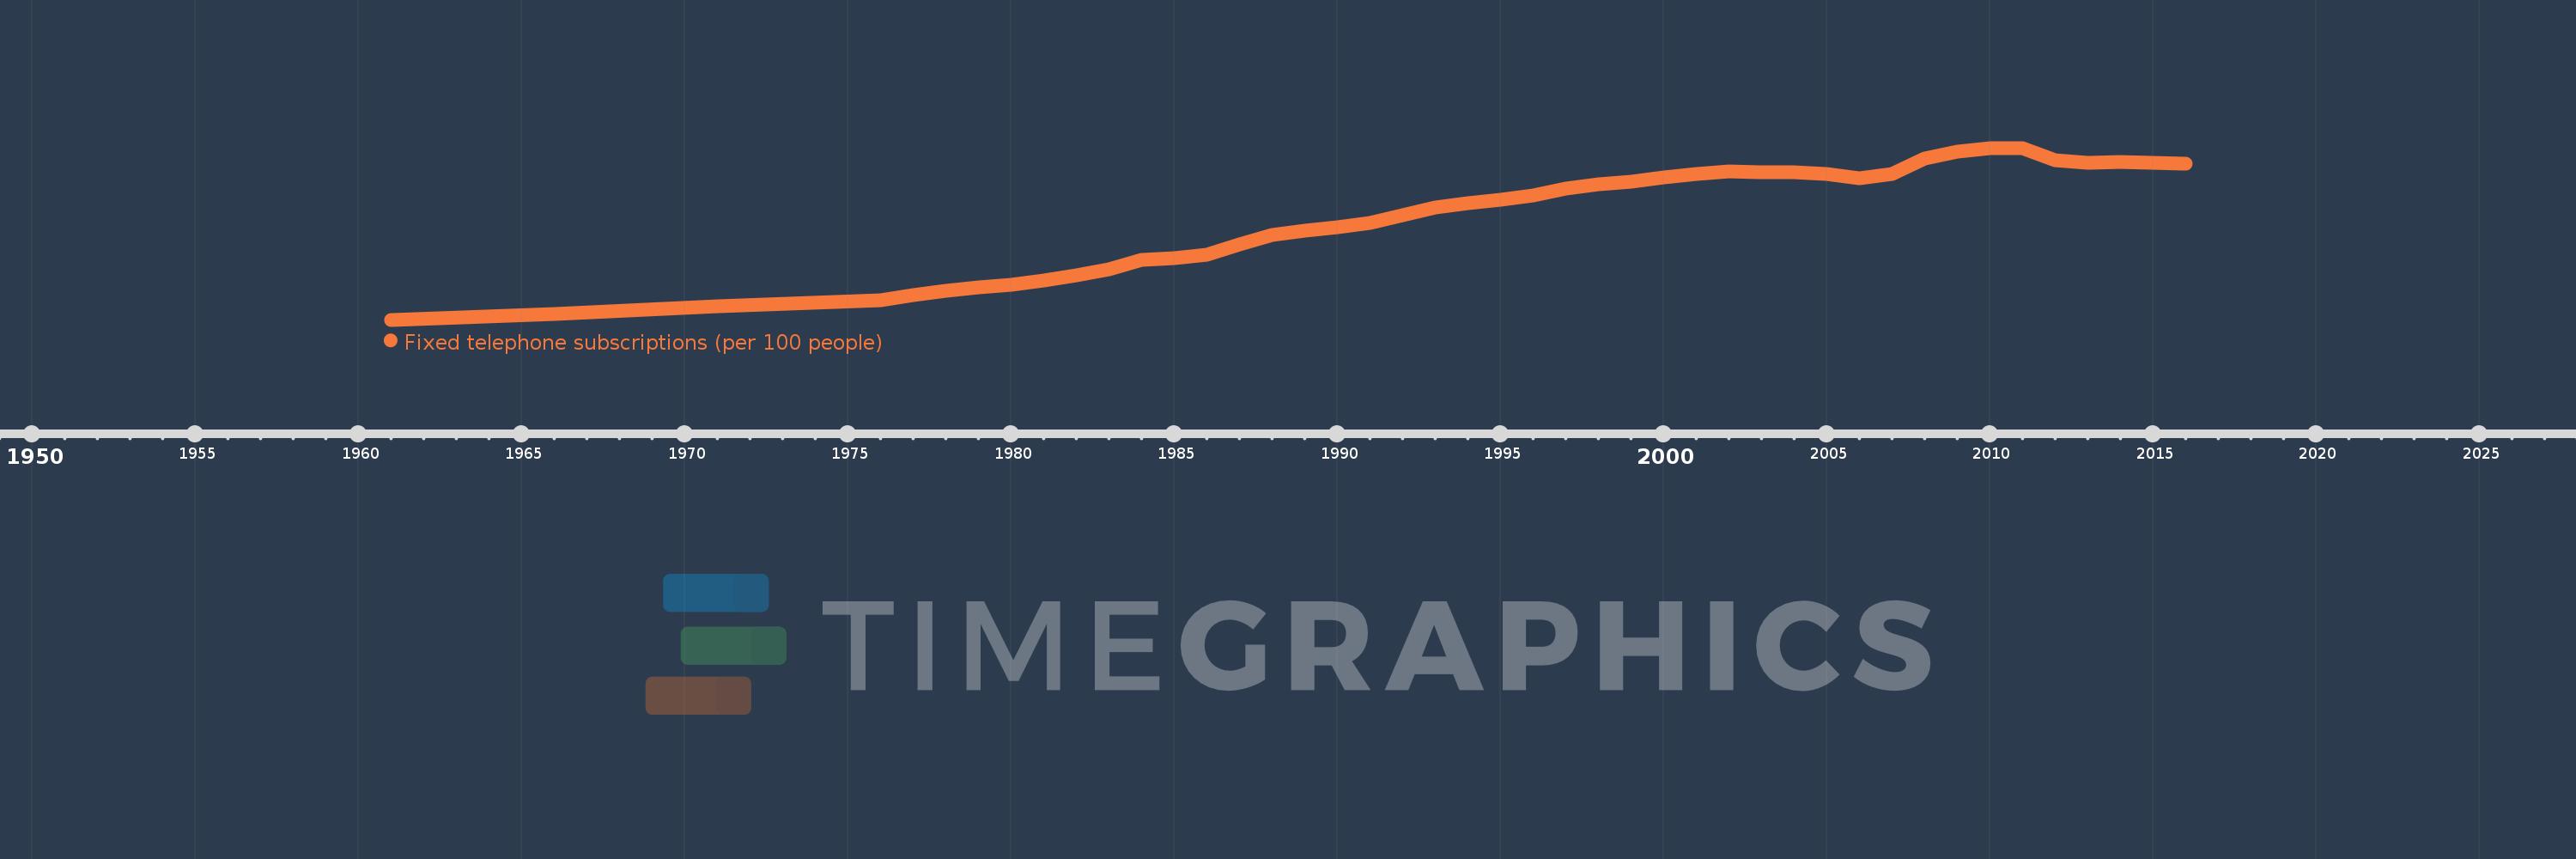
Fixed telephone subscriptions (per 100 people)
2016,2015,2014,2013,2012,2011,2010,2009,2008,2007,2006,2005,2004,2003,2002,2001,2000,1999,1998,1997,1996,1995,1994,1993,1992,1991,1990,1989,1988,1987,1986,1985,1984,1983,1982,1981,1980,1979,1978,1977,1976,1971,1966,1961
Queste statistiche in altri paesi:
AfghanistanAlbaniaAlgeriaAmerican SamoaAndorraAngolaAntigua and BarbudaArab WorldArgentinaArmeniaArubaAustraliaAustriaAzerbaijanBahamas, TheBahrainBangladeshBarbadosBelarusBelgiumBelizeBeninBermudaBhutanBoliviaBosnia and HerzegovinaBotswanaBrazilBritish Virgin IslandsBrunei DarussalamBulgariaBurkina FasoBurundiCabo VerdeCambodiaCameroonCanadaCaribbean small statesCayman IslandsCentral African RepublicCentral Europe and the BalticsChadChileChinaColombiaComorosCongo, Dem. Rep.Congo, Rep.Costa RicaCote d'IvoireCroatiaCubaCuracaoCyprusCzech RepublicDenmarkDjiboutiDominicaDominican RepublicEarly-demographic dividendEast Asia & PacificEast Asia & Pacific (excluding high income)East Asia & Pacific (IDA & IBRD countries)EcuadorEgypt, Arab Rep.El SalvadorEquatorial GuineaEritreaEstoniaEthiopiaEuro areaEurope & Central AsiaEurope & Central Asia (excluding high income)Europe & Central Asia (IDA & IBRD countries)European UnionFaroe IslandsFijiFinlandFragile and conflict affected situationsFranceFrench PolynesiaGabonGambia, TheGeorgiaGermanyGhanaGibraltarGreeceGreenlandGrenadaGuamGuatemalaGuineaGuinea-BissauGuyanaHaitiHeavily indebted poor countries (HIPC)High incomeHondurasHong Kong SAR, ChinaHungaryIBRD onlyIcelandIDA & IBRD totalIDA blendIDA onlyIDA totalIndiaIndonesiaIran, Islamic Rep.IraqIrelandIsraelItalyJamaicaJapanJordanKazakhstanKenyaKiribatiKorea, Dem. People’s Rep.Korea, Rep.KosovoKuwaitKyrgyz RepublicLao PDRLate-demographic dividendLatin America & Caribbean Latin America & Caribbean (excluding high income)Latin America & the Caribbean (IDA & IBRD countries)LatviaLeast developed countries: UN classificationLebanonLesothoLiberiaLibyaLiechtensteinLithuaniaLow & middle incomeLow incomeLower middle incomeLuxembourgMacao SAR, ChinaMacedonia, FYRMadagascarMalawiMalaysiaMaldivesMaliMaltaMarshall IslandsMauritaniaMauritiusMexicoMicronesia, Fed. Sts.Middle East & North AfricaMiddle East & North Africa (excluding high income)Middle East & North Africa (IDA & IBRD countries)Middle incomeMoldovaMonacoMongoliaMontenegroMoroccoMozambiqueMyanmarNamibiaNauruNepalNetherlandsNew CaledoniaNew ZealandNicaraguaNigerNigeriaNorth AmericaNorthern Mariana IslandsNorwayOECD membersOmanOther small statesPacific island small statesPakistanPalauPanamaPapua New GuineaParaguayPeruPhilippinesPolandPortugalPost-demographic dividendPre-demographic dividendPuerto RicoQatarRomaniaRussian FederationRwandaSamoaSan MarinoSao Tome and PrincipeSaudi ArabiaSenegalSerbiaSeychellesSierra LeoneSingaporeSlovak RepublicSloveniaSmall statesSolomon IslandsSomaliaSouth AfricaSouth AsiaSouth Asia (IDA & IBRD)South SudanSpainSri LankaSt. Kitts and NevisSt. LuciaSt. Vincent and the GrenadinesSub-Saharan Africa Sub-Saharan Africa (excluding high income)Sub-Saharan Africa (IDA & IBRD countries)SudanSurinameSwazilandSwedenSwitzerlandSyrian Arab RepublicTajikistanTanzaniaThailandTimor-LesteTogoTongaTrinidad and TobagoTunisiaTurkeyTurkmenistanTurks and Caicos IslandsTuvaluUgandaUkraineUnited Arab EmiratesUnited KingdomUnited StatesUpper middle incomeUruguayUzbekistanVanuatuVenezuela, RBVietnamVirgin Islands (U.S.)West Bank and GazaWorldYemen, Rep.ZambiaZimbabwe Linea del tempo:
Questa scala temporale mostra un grafico dal 1961 anno al 2016 anno. Malta. I dati fino ad 1960 anno non disponibili. Il numero di osservazioni attuali secondo i date: 44.
La fonte (nome):
Indicatori dello sviluppo mondiale
La fonte (organizzazione):
International Telecommunication Union, World Telecommunication/ICT Development Report and database.
Categorie:
Infrastructure
sono stati aggiornati
23 apr 2017 anni
Indicatori delle variazioni dei valori per anni
Minima:
2.949
1 gen 1961 anni
Massimo:
58.384
1 gen 2010 anni
Alla data di osservazione
Valore
Variazione assoluta
La variazione rispetto al valore precedente
1 gen 1961 anni
2.949
+2.949
0.0%
1 gen 1966 anni
4.689
+1.739
58.98%
1 gen 1971 anni
7.318
+2.629
56.08%
1 gen 1976 anni
9.268
+1.95
26.65%
1 gen 1977 anni
10.874
+1.606
17.33%
1 gen 1978 anni
12.284
+1.41
12.96%
1 gen 1979 anni
13.324
+1.04
8.46%
1 gen 1980 anni
14.313
+0.989
7.42%
1 gen 1981 anni
15.501
+1.188
8.3%
1 gen 1982 anni
17.213
+1.713
11.05%
1 gen 1983 anni
19.293
+2.08
12.08%
1 gen 1984 anni
22.318
+3.025
15.68%
1 gen 1985 anni
22.849
+0.531
2.38%
1 gen 1986 anni
23.883
+1.034
4.53%
1 gen 1987 anni
27.17
+3.287
13.76%
1 gen 1988 anni
30.399
+3.229
11.89%
1 gen 1989 anni
31.778
+1.379
4.53%
1 gen 1990 anni
32.88
+1.102
3.47%
1 gen 1991 anni
34.173
+1.293
3.93%
1 gen 1992 anni
36.566
+2.393
7.0%
1 gen 1993 anni
39.192
+2.626
7.18%
1 gen 1994 anni
40.586
+1.394
3.56%
1 gen 1995 anni
41.545
+0.96
2.36%
1 gen 1996 anni
43.152
+1.607
3.87%
1 gen 1997 anni
45.299
+2.147
4.98%
1 gen 1998 anni
46.588
+1.289
2.85%
1 gen 1999 anni
47.45
+0.861
1.85%
1 gen 2000 anni
48.744
+1.295
2.73%
1 gen 2001 anni
50.105
+1.361
2.79%
1 gen 2002 anni
50.779
+0.674
1.34%
1 gen 2003 anni
50.493
-0.286
-0.56%
1 gen 2004 anni
50.577
+0.084
0.17%
1 gen 2005 anni
49.986
-0.591
-1.17%
1 gen 2006 anni
48.732
-1.254
-2.51%
1 gen 2007 anni
50.017
+1.284
2.64%
1 gen 2008 anni
55.043
+5.027
10.05%
1 gen 2009 anni
57.3
+2.257
4.1%
1 gen 2010 anni
58.384
+1.084
1.89%
1 gen 2011 anni
58.303
-0.081
-0.14%
1 gen 2012 anni
54.462
-3.841
-6.59%
1 gen 2013 anni
53.707
-0.755
-1.39%
1 gen 2014 anni
53.923
+0.216
0.4%
1 gen 2015 anni
53.554
-0.369
-0.68%
1 gen 2016 anni
53.387
-0.167
-0.31%
Classificazione dei paesi secondo i statistiche attuali per anni


Commenti: