29
/it/
it
AIzaSyAYiBZKx7MnpbEhh9jyipgxe19OcubqV5w
April 1, 2024
76007
Bahamas, The
BHS
true
2
1
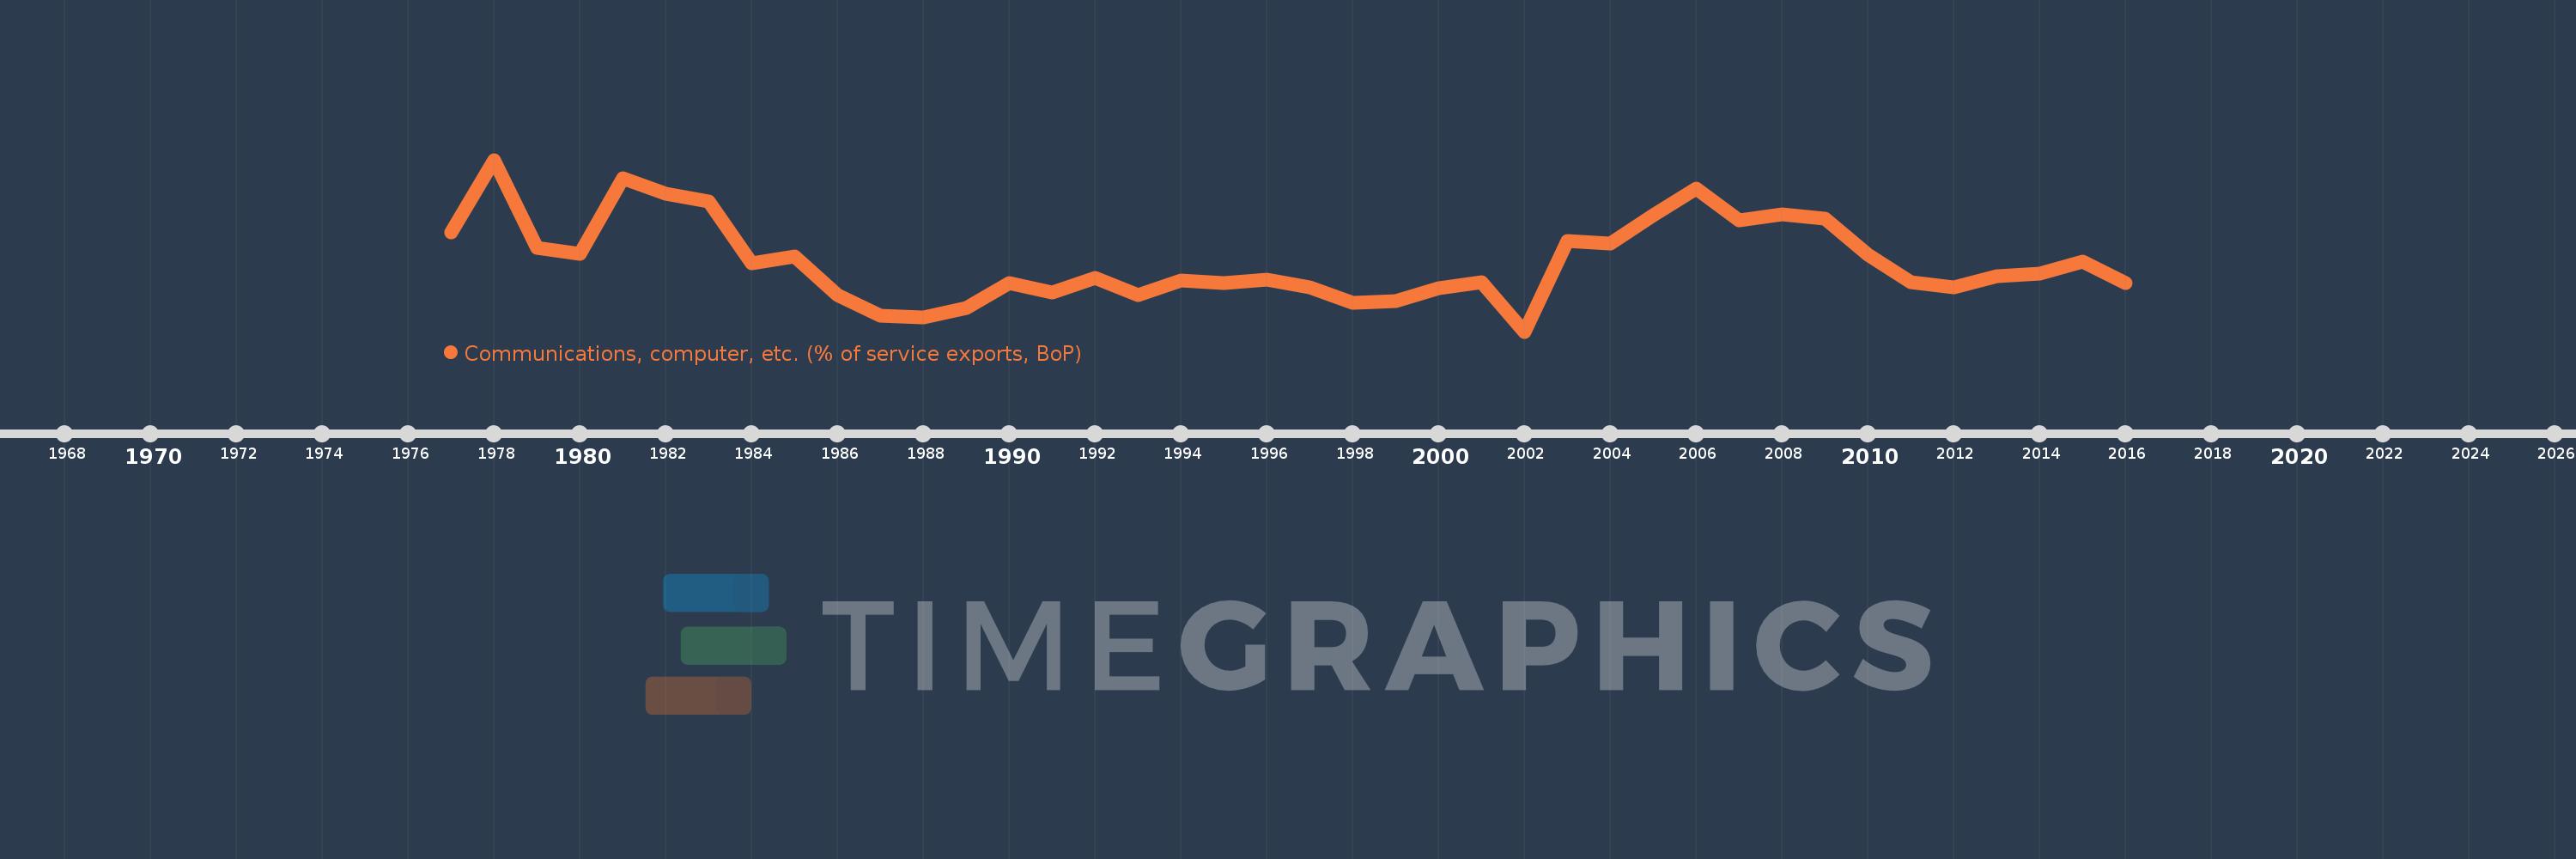
Communications, computer, etc. (% of service exports, BoP)
2016,2015,2014,2013,2012,2011,2010,2009,2008,2007,2006,2005,2004,2003,2002,2001,2000,1999,1998,1997,1996,1995,1994,1993,1992,1991,1990,1989,1988,1987,1986,1985,1984,1983,1982,1981,1980,1979,1978,1977
Queste statistiche in altri paesi:
AfghanistanAlbaniaAlgeriaAngolaAntigua and BarbudaArab WorldArgentinaArmeniaArubaAustraliaAustriaAzerbaijanBahamas, TheBahrainBangladeshBarbadosBelarusBelgiumBelizeBeninBermudaBhutanBoliviaBosnia and HerzegovinaBotswanaBrazilBrunei DarussalamBulgariaBurkina FasoBurundiCabo VerdeCambodiaCameroonCanadaCaribbean small statesCentral African RepublicCentral Europe and the BalticsChadChileChinaColombiaComorosCongo, Dem. Rep.Congo, Rep.Costa RicaCote d'IvoireCroatiaCuracaoCyprusCzech RepublicDenmarkDjiboutiDominicaDominican RepublicEarly-demographic dividendEast Asia & PacificEast Asia & Pacific (excluding high income)East Asia & Pacific (IDA & IBRD countries)EcuadorEgypt, Arab Rep.El SalvadorEquatorial GuineaEritreaEstoniaEthiopiaEuro areaEurope & Central AsiaEurope & Central Asia (excluding high income)Europe & Central Asia (IDA & IBRD countries)European UnionFaroe IslandsFijiFinlandFragile and conflict affected situationsFranceFrench PolynesiaGabonGambia, TheGeorgiaGermanyGhanaGreeceGrenadaGuatemalaGuineaGuinea-BissauGuyanaHaitiHeavily indebted poor countries (HIPC)High incomeHondurasHong Kong SAR, ChinaHungaryIBRD onlyIcelandIDA & IBRD totalIDA onlyIDA totalIndiaIndonesiaIran, Islamic Rep.IraqIrelandIsraelItalyJamaicaJapanJordanKazakhstanKenyaKiribatiKorea, Rep.KosovoKuwaitKyrgyz RepublicLao PDRLate-demographic dividendLatin America & Caribbean Latin America & Caribbean (excluding high income)Latin America & the Caribbean (IDA & IBRD countries)LatviaLeast developed countries: UN classificationLebanonLesothoLiberiaLibyaLithuaniaLow & middle incomeLow incomeLower middle incomeLuxembourgMacao SAR, ChinaMacedonia, FYRMadagascarMalawiMalaysiaMaldivesMaliMaltaMarshall IslandsMauritaniaMauritiusMexicoMicronesia, Fed. Sts.Middle East & North AfricaMiddle East & North Africa (excluding high income)Middle East & North Africa (IDA & IBRD countries)Middle incomeMoldovaMongoliaMontenegroMoroccoMozambiqueMyanmarNamibiaNepalNetherlandsNew CaledoniaNew ZealandNicaraguaNigerNigeriaNorth AmericaNorwayOECD membersOmanOther small statesPacific island small statesPakistanPalauPanamaPapua New GuineaParaguayPeruPhilippinesPolandPortugalPost-demographic dividendPre-demographic dividendQatarRomaniaRussian FederationRwandaSamoaSao Tome and PrincipeSaudi ArabiaSenegalSerbiaSeychellesSierra LeoneSingaporeSint Maarten (Dutch part)Slovak RepublicSloveniaSmall statesSolomon IslandsSouth AfricaSouth AsiaSouth Asia (IDA & IBRD)South SudanSpainSri LankaSt. Kitts and NevisSt. LuciaSt. Vincent and the GrenadinesSub-Saharan Africa Sub-Saharan Africa (excluding high income)Sub-Saharan Africa (IDA & IBRD countries)SudanSurinameSwazilandSwedenSwitzerlandSyrian Arab RepublicTajikistanTanzaniaThailandTimor-LesteTogoTongaTrinidad and TobagoTunisiaTurkeyTuvaluUgandaUkraineUnited KingdomUnited StatesUpper middle incomeUruguayVanuatuVenezuela, RBWest Bank and GazaWorldYemen, Rep.ZambiaZimbabwe Linea del tempo:
Questa scala temporale mostra un grafico dal 1977 anno al 2016 anno. Bahamas, The. I dati fino ad 1976 anno non disponibili. Il numero di osservazioni attuali secondo i date: 40.
La fonte (nome):
Indicatori dello sviluppo mondiale
La fonte (organizzazione):
International Monetary Fund, Balance of Payments Statistics Yearbook and data files.
Categorie:
Economy & Growth, Trade
sono stati aggiornati
23 apr 2017 anni
Indicatori delle variazioni dei valori per anni
Minima:
5.908
1 gen 2002 anni
Massimo:
17.202
1 gen 1978 anni
Alla data di osservazione
Valore
Variazione assoluta
La variazione rispetto al valore precedente
1 gen 1977 anni
12.432
+12.432
0.0%
1 gen 1978 anni
17.202
+4.77
38.37%
1 gen 1979 anni
11.439
-5.763
-33.5%
1 gen 1980 anni
11.018
-0.421
-3.68%
1 gen 1981 anni
15.992
+4.974
45.14%
1 gen 1982 anni
14.959
-1.033
-6.46%
1 gen 1983 anni
14.482
-0.477
-3.19%
1 gen 1984 anni
10.425
-4.056
-28.01%
1 gen 1985 anni
10.846
+0.421
4.04%
1 gen 1986 anni
8.29
-2.557
-23.57%
1 gen 1987 anni
6.967
-1.323
-15.96%
1 gen 1988 anni
6.835
-0.132
-1.89%
1 gen 1989 anni
7.489
+0.654
9.57%
1 gen 1990 anni
9.116
+1.627
21.73%
1 gen 1991 anni
8.486
-0.63
-6.91%
1 gen 1992 anni
9.431
+0.945
11.14%
1 gen 1993 anni
8.29
-1.141
-12.1%
1 gen 1994 anni
9.28
+0.99
11.94%
1 gen 1995 anni
9.116
-0.165
-1.78%
1 gen 1996 anni
9.33
+0.215
2.35%
1 gen 1997 anni
8.814
-0.516
-5.53%
1 gen 1998 anni
7.797
-1.017
-11.54%
1 gen 1999 anni
7.906
+0.109
1.4%
1 gen 2000 anni
8.758
+0.852
10.78%
1 gen 2001 anni
9.164
+0.406
4.63%
1 gen 2002 anni
5.908
-3.256
-35.53%
1 gen 2003 anni
11.857
+5.949
100.7%
1 gen 2004 anni
11.71
-0.147
-1.24%
1 gen 2005 anni
13.56
+1.85
15.8%
1 gen 2006 anni
15.324
+1.764
13.01%
1 gen 2007 anni
13.228
-2.096
-13.68%
1 gen 2008 anni
13.642
+0.414
3.13%
1 gen 2009 anni
13.317
-0.325
-2.38%
1 gen 2010 anni
10.952
-2.366
-17.76%
1 gen 2011 anni
9.166
-1.786
-16.31%
1 gen 2012 anni
8.842
-0.323
-3.53%
1 gen 2013 anni
9.524
+0.682
7.71%
1 gen 2014 anni
9.7
+0.176
1.85%
1 gen 2015 anni
10.523
+0.822
8.48%
1 gen 2016 anni
9.124
-1.399
-13.29%
Classificazione dei paesi secondo i statistiche attuali per anni


Commenti: