29
/it/
it
AIzaSyAYiBZKx7MnpbEhh9jyipgxe19OcubqV5w
April 1, 2024
260650
Tanzania
TZA
true
2
1
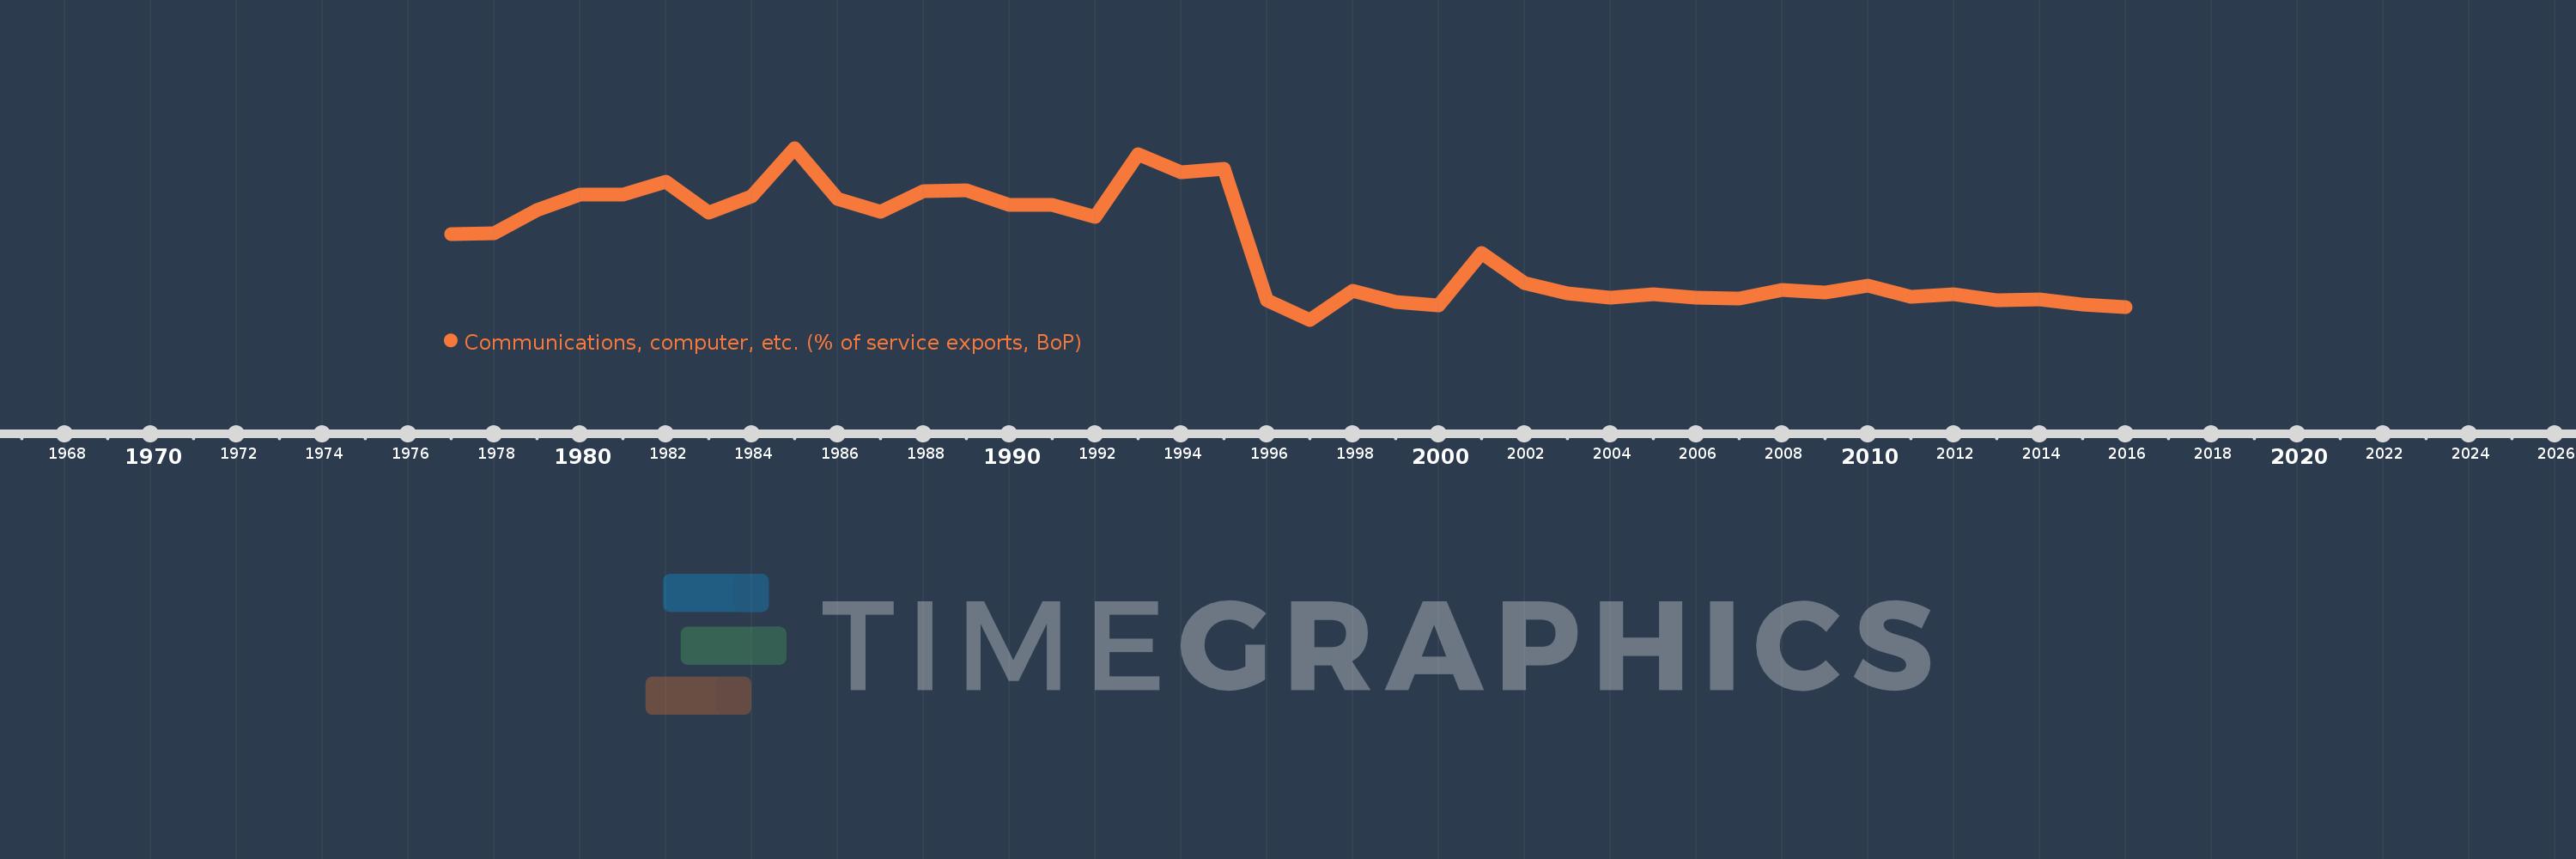
Communications, computer, etc. (% of service exports, BoP)
2016,2015,2014,2013,2012,2011,2010,2009,2008,2007,2006,2005,2004,2003,2002,2001,2000,1999,1998,1997,1996,1995,1994,1993,1992,1991,1990,1989,1988,1987,1986,1985,1984,1983,1982,1981,1980,1979,1978,1977
Queste statistiche in altri paesi:
AfghanistanAlbaniaAlgeriaAngolaAntigua and BarbudaArab WorldArgentinaArmeniaArubaAustraliaAustriaAzerbaijanBahamas, TheBahrainBangladeshBarbadosBelarusBelgiumBelizeBeninBermudaBhutanBoliviaBosnia and HerzegovinaBotswanaBrazilBrunei DarussalamBulgariaBurkina FasoBurundiCabo VerdeCambodiaCameroonCanadaCaribbean small statesCentral African RepublicCentral Europe and the BalticsChadChileChinaColombiaComorosCongo, Dem. Rep.Congo, Rep.Costa RicaCote d'IvoireCroatiaCuracaoCyprusCzech RepublicDenmarkDjiboutiDominicaDominican RepublicEarly-demographic dividendEast Asia & PacificEast Asia & Pacific (excluding high income)East Asia & Pacific (IDA & IBRD countries)EcuadorEgypt, Arab Rep.El SalvadorEquatorial GuineaEritreaEstoniaEthiopiaEuro areaEurope & Central AsiaEurope & Central Asia (excluding high income)Europe & Central Asia (IDA & IBRD countries)European UnionFaroe IslandsFijiFinlandFragile and conflict affected situationsFranceFrench PolynesiaGabonGambia, TheGeorgiaGermanyGhanaGreeceGrenadaGuatemalaGuineaGuinea-BissauGuyanaHaitiHeavily indebted poor countries (HIPC)High incomeHondurasHong Kong SAR, ChinaHungaryIBRD onlyIcelandIDA & IBRD totalIDA onlyIDA totalIndiaIndonesiaIran, Islamic Rep.IraqIrelandIsraelItalyJamaicaJapanJordanKazakhstanKenyaKiribatiKorea, Rep.KosovoKuwaitKyrgyz RepublicLao PDRLate-demographic dividendLatin America & Caribbean Latin America & Caribbean (excluding high income)Latin America & the Caribbean (IDA & IBRD countries)LatviaLeast developed countries: UN classificationLebanonLesothoLiberiaLibyaLithuaniaLow & middle incomeLow incomeLower middle incomeLuxembourgMacao SAR, ChinaMacedonia, FYRMadagascarMalawiMalaysiaMaldivesMaliMaltaMarshall IslandsMauritaniaMauritiusMexicoMicronesia, Fed. Sts.Middle East & North AfricaMiddle East & North Africa (excluding high income)Middle East & North Africa (IDA & IBRD countries)Middle incomeMoldovaMongoliaMontenegroMoroccoMozambiqueMyanmarNamibiaNepalNetherlandsNew CaledoniaNew ZealandNicaraguaNigerNigeriaNorth AmericaNorwayOECD membersOmanOther small statesPacific island small statesPakistanPalauPanamaPapua New GuineaParaguayPeruPhilippinesPolandPortugalPost-demographic dividendPre-demographic dividendQatarRomaniaRussian FederationRwandaSamoaSao Tome and PrincipeSaudi ArabiaSenegalSerbiaSeychellesSierra LeoneSingaporeSint Maarten (Dutch part)Slovak RepublicSloveniaSmall statesSolomon IslandsSouth AfricaSouth AsiaSouth Asia (IDA & IBRD)South SudanSpainSri LankaSt. Kitts and NevisSt. LuciaSt. Vincent and the GrenadinesSub-Saharan Africa Sub-Saharan Africa (excluding high income)Sub-Saharan Africa (IDA & IBRD countries)SudanSurinameSwazilandSwedenSwitzerlandSyrian Arab RepublicTajikistanTanzaniaThailandTimor-LesteTogoTongaTrinidad and TobagoTunisiaTurkeyTuvaluUgandaUkraineUnited KingdomUnited StatesUpper middle incomeUruguayVanuatuVenezuela, RBWest Bank and GazaWorldYemen, Rep.ZambiaZimbabwe Linea del tempo:
Questa scala temporale mostra un grafico dal 1977 anno al 2016 anno. Tanzania. I dati fino ad 1976 anno non disponibili. Il numero di osservazioni attuali secondo i date: 40.
La fonte (nome):
Indicatori dello sviluppo mondiale
La fonte (organizzazione):
International Monetary Fund, Balance of Payments Statistics Yearbook and data files.
Categorie:
Economy & Growth, Trade
sono stati aggiornati
23 apr 2017 anni
Indicatori delle variazioni dei valori per anni
Minima:
7.657
1 gen 1997 anni
Massimo:
60.754
1 gen 1985 anni
Alla data di osservazione
Valore
Variazione assoluta
La variazione rispetto al valore precedente
1 gen 1977 anni
34.127
+34.127
0.0%
1 gen 1978 anni
34.35
+0.223
0.65%
1 gen 1979 anni
41.534
+7.184
20.91%
1 gen 1980 anni
46.348
+4.814
11.59%
1 gen 1981 anni
46.415
+0.068
0.15%
1 gen 1982 anni
50.229
+3.813
8.22%
1 gen 1983 anni
40.734
-9.495
-18.9%
1 gen 1984 anni
45.738
+5.005
12.29%
1 gen 1985 anni
60.754
+15.016
32.83%
1 gen 1986 anni
44.878
-15.876
-26.13%
1 gen 1987 anni
40.984
-3.894
-8.68%
1 gen 1988 anni
47.363
+6.379
15.57%
1 gen 1989 anni
47.675
+0.312
0.66%
1 gen 1990 anni
43.068
-4.607
-9.66%
1 gen 1991 anni
43.096
+0.028
0.07%
1 gen 1992 anni
39.397
-3.699
-8.58%
1 gen 1993 anni
58.923
+19.527
49.56%
1 gen 1994 anni
53.184
-5.739
-9.74%
1 gen 1995 anni
54.426
+1.242
2.33%
1 gen 1996 anni
13.601
-40.825
-75.01%
1 gen 1997 anni
7.657
-5.944
-43.7%
1 gen 1998 anni
16.493
+8.836
115.4%
1 gen 1999 anni
13.274
-3.219
-19.52%
1 gen 2000 anni
12.027
-1.247
-9.39%
1 gen 2001 anni
28.196
+16.168
134.43%
1 gen 2002 anni
19.118
-9.078
-32.2%
1 gen 2003 anni
15.705
-3.412
-17.85%
1 gen 2004 anni
14.608
-1.098
-6.99%
1 gen 2005 anni
15.585
+0.977
6.69%
1 gen 2006 anni
14.399
-1.185
-7.6%
1 gen 2007 anni
14.299
-0.1
-0.7%
1 gen 2008 anni
16.929
+2.63
18.39%
1 gen 2009 anni
16.062
-0.867
-5.12%
1 gen 2010 anni
18.283
+2.221
13.83%
1 gen 2011 anni
14.716
-3.567
-19.51%
1 gen 2012 anni
15.536
+0.82
5.57%
1 gen 2013 anni
13.753
-1.783
-11.48%
1 gen 2014 anni
13.886
+0.133
0.97%
1 gen 2015 anni
12.462
-1.424
-10.25%
1 gen 2016 anni
11.503
-0.96
-7.7%
Classificazione dei paesi secondo i statistiche attuali per anni


Commenti: