29
/it/
it
AIzaSyAYiBZKx7MnpbEhh9jyipgxe19OcubqV5w
April 1, 2024
53976
Pacific island small states
PSS
false
2
1
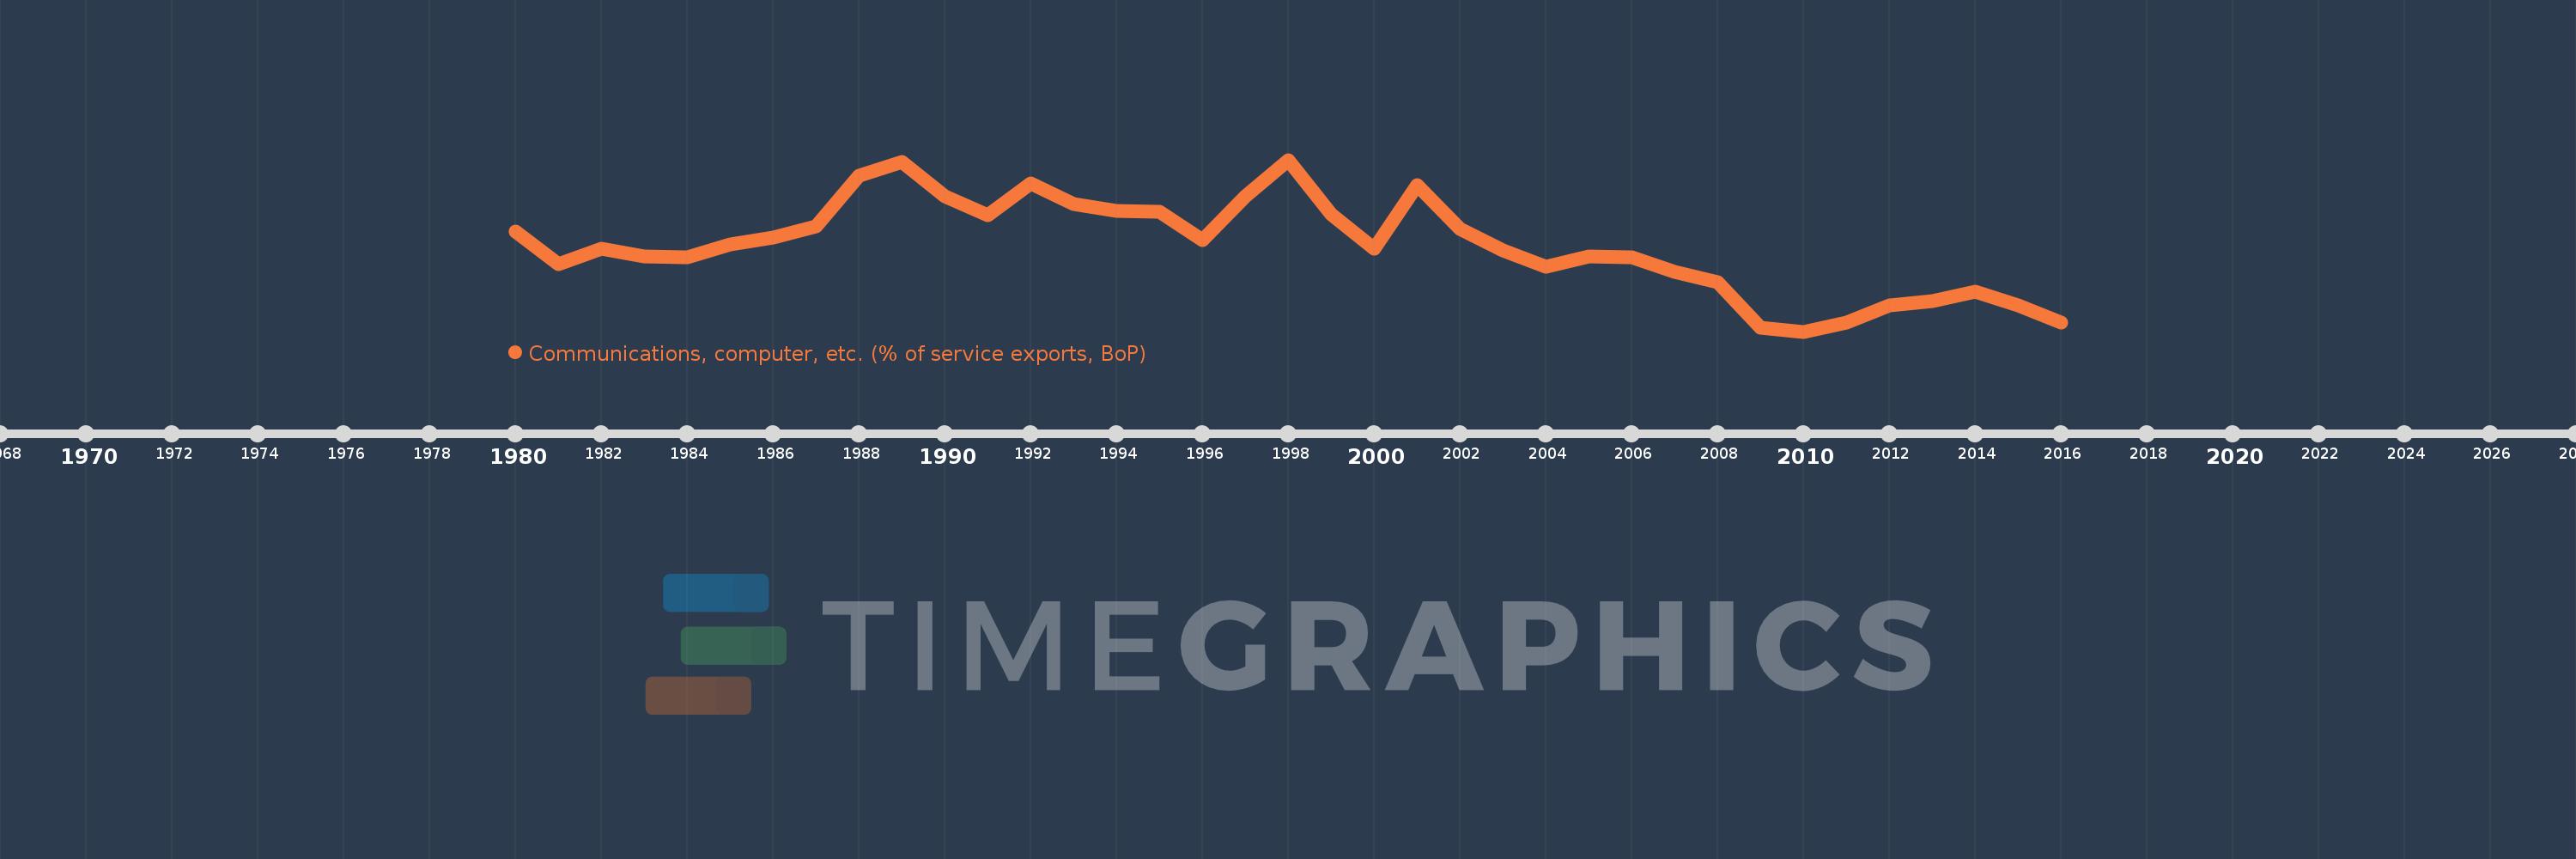
Communications, computer, etc. (% of service exports, BoP)
2016,2015,2014,2013,2012,2011,2010,2009,2008,2007,2006,2005,2004,2003,2002,2001,2000,1999,1998,1997,1996,1995,1994,1993,1992,1991,1990,1989,1988,1987,1986,1985,1984,1983,1982,1981,1980
Queste statistiche in altri paesi:
AfghanistanAlbaniaAlgeriaAngolaAntigua and BarbudaArab WorldArgentinaArmeniaArubaAustraliaAustriaAzerbaijanBahamas, TheBahrainBangladeshBarbadosBelarusBelgiumBelizeBeninBermudaBhutanBoliviaBosnia and HerzegovinaBotswanaBrazilBrunei DarussalamBulgariaBurkina FasoBurundiCabo VerdeCambodiaCameroonCanadaCaribbean small statesCentral African RepublicCentral Europe and the BalticsChadChileChinaColombiaComorosCongo, Dem. Rep.Congo, Rep.Costa RicaCote d'IvoireCroatiaCuracaoCyprusCzech RepublicDenmarkDjiboutiDominicaDominican RepublicEarly-demographic dividendEast Asia & PacificEast Asia & Pacific (excluding high income)East Asia & Pacific (IDA & IBRD countries)EcuadorEgypt, Arab Rep.El SalvadorEquatorial GuineaEritreaEstoniaEthiopiaEuro areaEurope & Central AsiaEurope & Central Asia (excluding high income)Europe & Central Asia (IDA & IBRD countries)European UnionFaroe IslandsFijiFinlandFragile and conflict affected situationsFranceFrench PolynesiaGabonGambia, TheGeorgiaGermanyGhanaGreeceGrenadaGuatemalaGuineaGuinea-BissauGuyanaHaitiHeavily indebted poor countries (HIPC)High incomeHondurasHong Kong SAR, ChinaHungaryIBRD onlyIcelandIDA & IBRD totalIDA onlyIDA totalIndiaIndonesiaIran, Islamic Rep.IraqIrelandIsraelItalyJamaicaJapanJordanKazakhstanKenyaKiribatiKorea, Rep.KosovoKuwaitKyrgyz RepublicLao PDRLate-demographic dividendLatin America & Caribbean Latin America & Caribbean (excluding high income)Latin America & the Caribbean (IDA & IBRD countries)LatviaLeast developed countries: UN classificationLebanonLesothoLiberiaLibyaLithuaniaLow & middle incomeLow incomeLower middle incomeLuxembourgMacao SAR, ChinaMacedonia, FYRMadagascarMalawiMalaysiaMaldivesMaliMaltaMarshall IslandsMauritaniaMauritiusMexicoMicronesia, Fed. Sts.Middle East & North AfricaMiddle East & North Africa (excluding high income)Middle East & North Africa (IDA & IBRD countries)Middle incomeMoldovaMongoliaMontenegroMoroccoMozambiqueMyanmarNamibiaNepalNetherlandsNew CaledoniaNew ZealandNicaraguaNigerNigeriaNorth AmericaNorwayOECD membersOmanOther small statesPacific island small statesPakistanPalauPanamaPapua New GuineaParaguayPeruPhilippinesPolandPortugalPost-demographic dividendPre-demographic dividendQatarRomaniaRussian FederationRwandaSamoaSao Tome and PrincipeSaudi ArabiaSenegalSerbiaSeychellesSierra LeoneSingaporeSint Maarten (Dutch part)Slovak RepublicSloveniaSmall statesSolomon IslandsSouth AfricaSouth AsiaSouth Asia (IDA & IBRD)South SudanSpainSri LankaSt. Kitts and NevisSt. LuciaSt. Vincent and the GrenadinesSub-Saharan Africa Sub-Saharan Africa (excluding high income)Sub-Saharan Africa (IDA & IBRD countries)SudanSurinameSwazilandSwedenSwitzerlandSyrian Arab RepublicTajikistanTanzaniaThailandTimor-LesteTogoTongaTrinidad and TobagoTunisiaTurkeyTuvaluUgandaUkraineUnited KingdomUnited StatesUpper middle incomeUruguayVanuatuVenezuela, RBWest Bank and GazaWorldYemen, Rep.ZambiaZimbabwe Linea del tempo:
Questa scala temporale mostra un grafico dal 1980 anno al 2016 anno. Pacific island small states. I dati fino ad 1979 anno non disponibili. Il numero di osservazioni attuali secondo i date: 37.
La fonte (nome):
Indicatori dello sviluppo mondiale
La fonte (organizzazione):
International Monetary Fund, Balance of Payments Statistics Yearbook and data files.
Categorie:
Economy & Growth, Trade
sono stati aggiornati
23 apr 2017 anni
Indicatori delle variazioni dei valori per anni
Minima:
11.015
1 gen 2010 anni
Massimo:
32.075
1 gen 1998 anni
Alla data di osservazione
Valore
Variazione assoluta
La variazione rispetto al valore precedente
1 gen 1980 anni
23.239
+23.239
0.0%
1 gen 1981 anni
19.315
-3.924
-16.88%
1 gen 1982 anni
21.144
+1.829
9.47%
1 gen 1983 anni
20.219
-0.925
-4.38%
1 gen 1984 anni
20.088
-0.131
-0.65%
1 gen 1985 anni
21.745
+1.657
8.25%
1 gen 1986 anni
22.501
+0.756
3.48%
1 gen 1987 anni
23.924
+1.423
6.32%
1 gen 1988 anni
30.126
+6.202
25.92%
1 gen 1989 anni
31.811
+1.685
5.59%
1 gen 1990 anni
27.646
-4.165
-13.09%
1 gen 1991 anni
25.275
-2.371
-8.58%
1 gen 1992 anni
29.147
+3.872
15.32%
1 gen 1993 anni
26.68
-2.467
-8.46%
1 gen 1994 anni
25.851
-0.829
-3.11%
1 gen 1995 anni
25.75
-0.101
-0.39%
1 gen 1996 anni
22.185
-3.565
-13.85%
1 gen 1997 anni
27.64
+5.455
24.59%
1 gen 1998 anni
32.075
+4.435
16.05%
1 gen 1999 anni
25.393
-6.682
-20.83%
1 gen 2000 anni
21.128
-4.264
-16.79%
1 gen 2001 anni
28.979
+7.85
37.16%
1 gen 2002 anni
23.595
-5.384
-18.58%
1 gen 2003 anni
20.933
-2.662
-11.28%
1 gen 2004 anni
18.966
-1.967
-9.4%
1 gen 2005 anni
20.22
+1.254
6.61%
1 gen 2006 anni
20.131
-0.089
-0.44%
1 gen 2007 anni
18.332
-1.799
-8.94%
1 gen 2008 anni
17.115
-1.217
-6.64%
1 gen 2009 anni
11.502
-5.612
-32.79%
1 gen 2010 anni
11.015
-0.488
-4.24%
1 gen 2011 anni
12.103
+1.088
9.88%
1 gen 2012 anni
14.273
+2.17
17.93%
1 gen 2013 anni
14.798
+0.526
3.68%
1 gen 2014 anni
15.861
+1.063
7.18%
1 gen 2015 anni
14.176
-1.685
-10.62%
1 gen 2016 anni
12.138
-2.039
-14.38%
Classificazione dei paesi secondo i statistiche attuali per anni


Commenti: