29
/it/
it
AIzaSyAYiBZKx7MnpbEhh9jyipgxe19OcubqV5w
April 1, 2024
62456
World
WLD
false
2
1
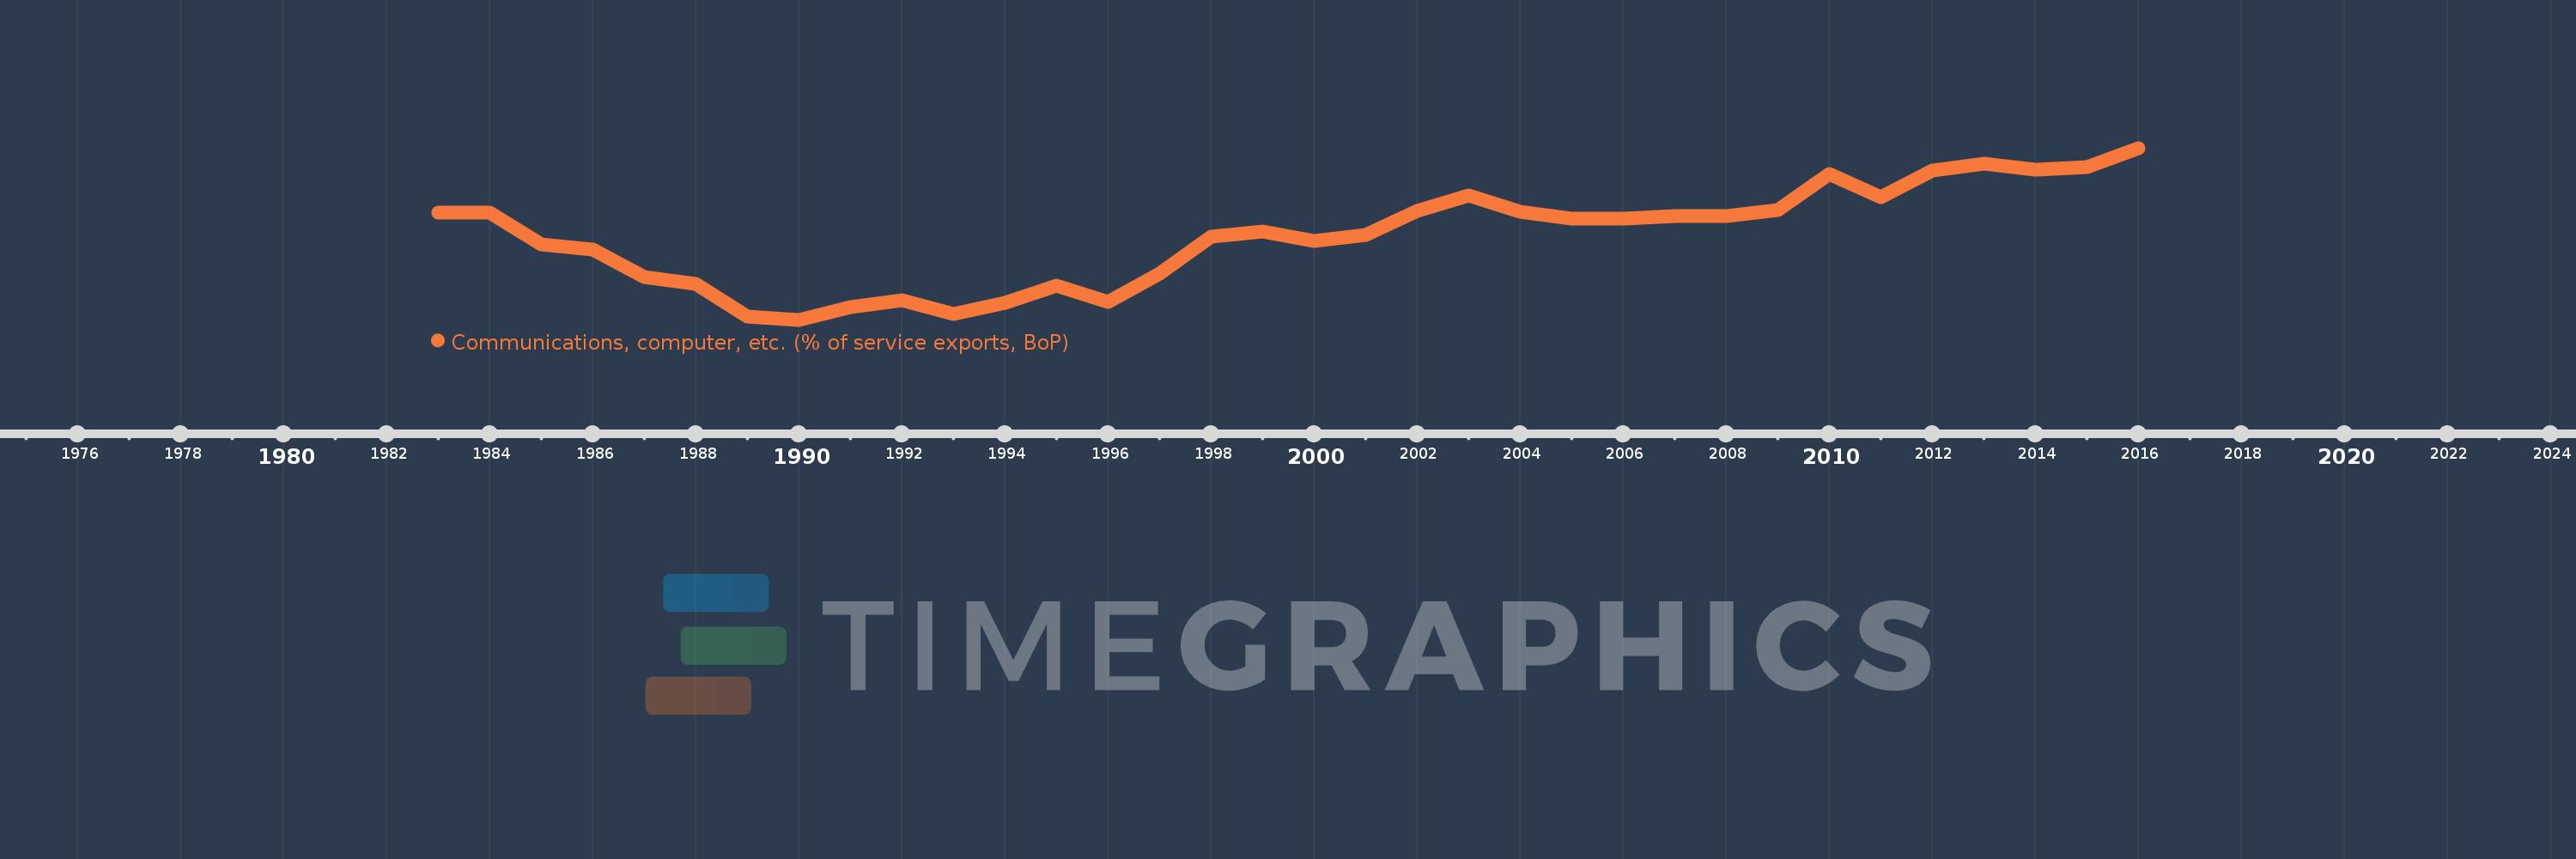
Communications, computer, etc. (% of service exports, BoP)
2016,2015,2014,2013,2012,2011,2010,2009,2008,2007,2006,2005,2004,2003,2002,2001,2000,1999,1998,1997,1996,1995,1994,1993,1992,1991,1990,1989,1988,1987,1986,1985,1984,1983
Queste statistiche in altri paesi:
AfghanistanAlbaniaAlgeriaAngolaAntigua and BarbudaArab WorldArgentinaArmeniaArubaAustraliaAustriaAzerbaijanBahamas, TheBahrainBangladeshBarbadosBelarusBelgiumBelizeBeninBermudaBhutanBoliviaBosnia and HerzegovinaBotswanaBrazilBrunei DarussalamBulgariaBurkina FasoBurundiCabo VerdeCambodiaCameroonCanadaCaribbean small statesCentral African RepublicCentral Europe and the BalticsChadChileChinaColombiaComorosCongo, Dem. Rep.Congo, Rep.Costa RicaCote d'IvoireCroatiaCuracaoCyprusCzech RepublicDenmarkDjiboutiDominicaDominican RepublicEarly-demographic dividendEast Asia & PacificEast Asia & Pacific (excluding high income)East Asia & Pacific (IDA & IBRD countries)EcuadorEgypt, Arab Rep.El SalvadorEquatorial GuineaEritreaEstoniaEthiopiaEuro areaEurope & Central AsiaEurope & Central Asia (excluding high income)Europe & Central Asia (IDA & IBRD countries)European UnionFaroe IslandsFijiFinlandFragile and conflict affected situationsFranceFrench PolynesiaGabonGambia, TheGeorgiaGermanyGhanaGreeceGrenadaGuatemalaGuineaGuinea-BissauGuyanaHaitiHeavily indebted poor countries (HIPC)High incomeHondurasHong Kong SAR, ChinaHungaryIBRD onlyIcelandIDA & IBRD totalIDA onlyIDA totalIndiaIndonesiaIran, Islamic Rep.IraqIrelandIsraelItalyJamaicaJapanJordanKazakhstanKenyaKiribatiKorea, Rep.KosovoKuwaitKyrgyz RepublicLao PDRLate-demographic dividendLatin America & Caribbean Latin America & Caribbean (excluding high income)Latin America & the Caribbean (IDA & IBRD countries)LatviaLeast developed countries: UN classificationLebanonLesothoLiberiaLibyaLithuaniaLow & middle incomeLow incomeLower middle incomeLuxembourgMacao SAR, ChinaMacedonia, FYRMadagascarMalawiMalaysiaMaldivesMaliMaltaMarshall IslandsMauritaniaMauritiusMexicoMicronesia, Fed. Sts.Middle East & North AfricaMiddle East & North Africa (excluding high income)Middle East & North Africa (IDA & IBRD countries)Middle incomeMoldovaMongoliaMontenegroMoroccoMozambiqueMyanmarNamibiaNepalNetherlandsNew CaledoniaNew ZealandNicaraguaNigerNigeriaNorth AmericaNorwayOECD membersOmanOther small statesPacific island small statesPakistanPalauPanamaPapua New GuineaParaguayPeruPhilippinesPolandPortugalPost-demographic dividendPre-demographic dividendQatarRomaniaRussian FederationRwandaSamoaSao Tome and PrincipeSaudi ArabiaSenegalSerbiaSeychellesSierra LeoneSingaporeSint Maarten (Dutch part)Slovak RepublicSloveniaSmall statesSolomon IslandsSouth AfricaSouth AsiaSouth Asia (IDA & IBRD)South SudanSpainSri LankaSt. Kitts and NevisSt. LuciaSt. Vincent and the GrenadinesSub-Saharan Africa Sub-Saharan Africa (excluding high income)Sub-Saharan Africa (IDA & IBRD countries)SudanSurinameSwazilandSwedenSwitzerlandSyrian Arab RepublicTajikistanTanzaniaThailandTimor-LesteTogoTongaTrinidad and TobagoTunisiaTurkeyTuvaluUgandaUkraineUnited KingdomUnited StatesUpper middle incomeUruguayVanuatuVenezuela, RBWest Bank and GazaWorldYemen, Rep.ZambiaZimbabwe Linea del tempo:
Questa scala temporale mostra un grafico dal 1983 anno al 2016 anno. World. I dati fino ad 1982 anno non disponibili. Il numero di osservazioni attuali secondo i date: 34.
La fonte (nome):
Indicatori dello sviluppo mondiale
La fonte (organizzazione):
International Monetary Fund, Balance of Payments Statistics Yearbook and data files.
Categorie:
Economy & Growth, Trade
sono stati aggiornati
23 apr 2017 anni
Indicatori delle variazioni dei valori per anni
Minima:
35.759
1 gen 1990 anni
Massimo:
45.981
1 gen 2016 anni
Alla data di osservazione
Valore
Variazione assoluta
La variazione rispetto al valore precedente
1 gen 1983 anni
42.14
+42.14
0.0%
1 gen 1984 anni
42.12
-0.02
-0.05%
1 gen 1985 anni
40.252
-1.868
-4.43%
1 gen 1986 anni
39.943
-0.308
-0.77%
1 gen 1987 anni
38.311
-1.633
-4.09%
1 gen 1988 anni
37.882
-0.429
-1.12%
1 gen 1989 anni
35.963
-1.919
-5.07%
1 gen 1990 anni
35.759
-0.204
-0.57%
1 gen 1991 anni
36.518
+0.759
2.12%
1 gen 1992 anni
36.937
+0.42
1.15%
1 gen 1993 anni
36.107
-0.831
-2.25%
1 gen 1994 anni
36.75
+0.643
1.78%
1 gen 1995 anni
37.807
+1.057
2.88%
1 gen 1996 anni
36.815
-0.991
-2.62%
1 gen 1997 anni
38.503
+1.688
4.59%
1 gen 1998 anni
40.697
+2.193
5.7%
1 gen 1999 anni
41.033
+0.336
0.83%
1 gen 2000 anni
40.46
-0.573
-1.4%
1 gen 2001 anni
40.82
+0.36
0.89%
1 gen 2002 anni
42.232
+1.412
3.46%
1 gen 2003 anni
43.151
+0.919
2.18%
1 gen 2004 anni
42.165
-0.985
-2.28%
1 gen 2005 anni
41.779
-0.387
-0.92%
1 gen 2006 anni
41.782
+0.003
0.01%
1 gen 2007 anni
41.936
+0.155
0.37%
1 gen 2008 anni
41.937
+0.001
0.0%
1 gen 2009 anni
42.272
+0.335
0.8%
1 gen 2010 anni
44.426
+2.154
5.1%
1 gen 2011 anni
43.039
-1.387
-3.12%
1 gen 2012 anni
44.613
+1.574
3.66%
1 gen 2013 anni
45.06
+0.447
1.0%
1 gen 2014 anni
44.664
-0.396
-0.88%
1 gen 2015 anni
44.832
+0.168
0.38%
1 gen 2016 anni
45.981
+1.149
2.56%
Classificazione dei paesi secondo i statistiche attuali per anni


Commenti: