29
/it/
it
AIzaSyAYiBZKx7MnpbEhh9jyipgxe19OcubqV5w
April 1, 2024
62140
Upper middle income
UMC
false
2
1
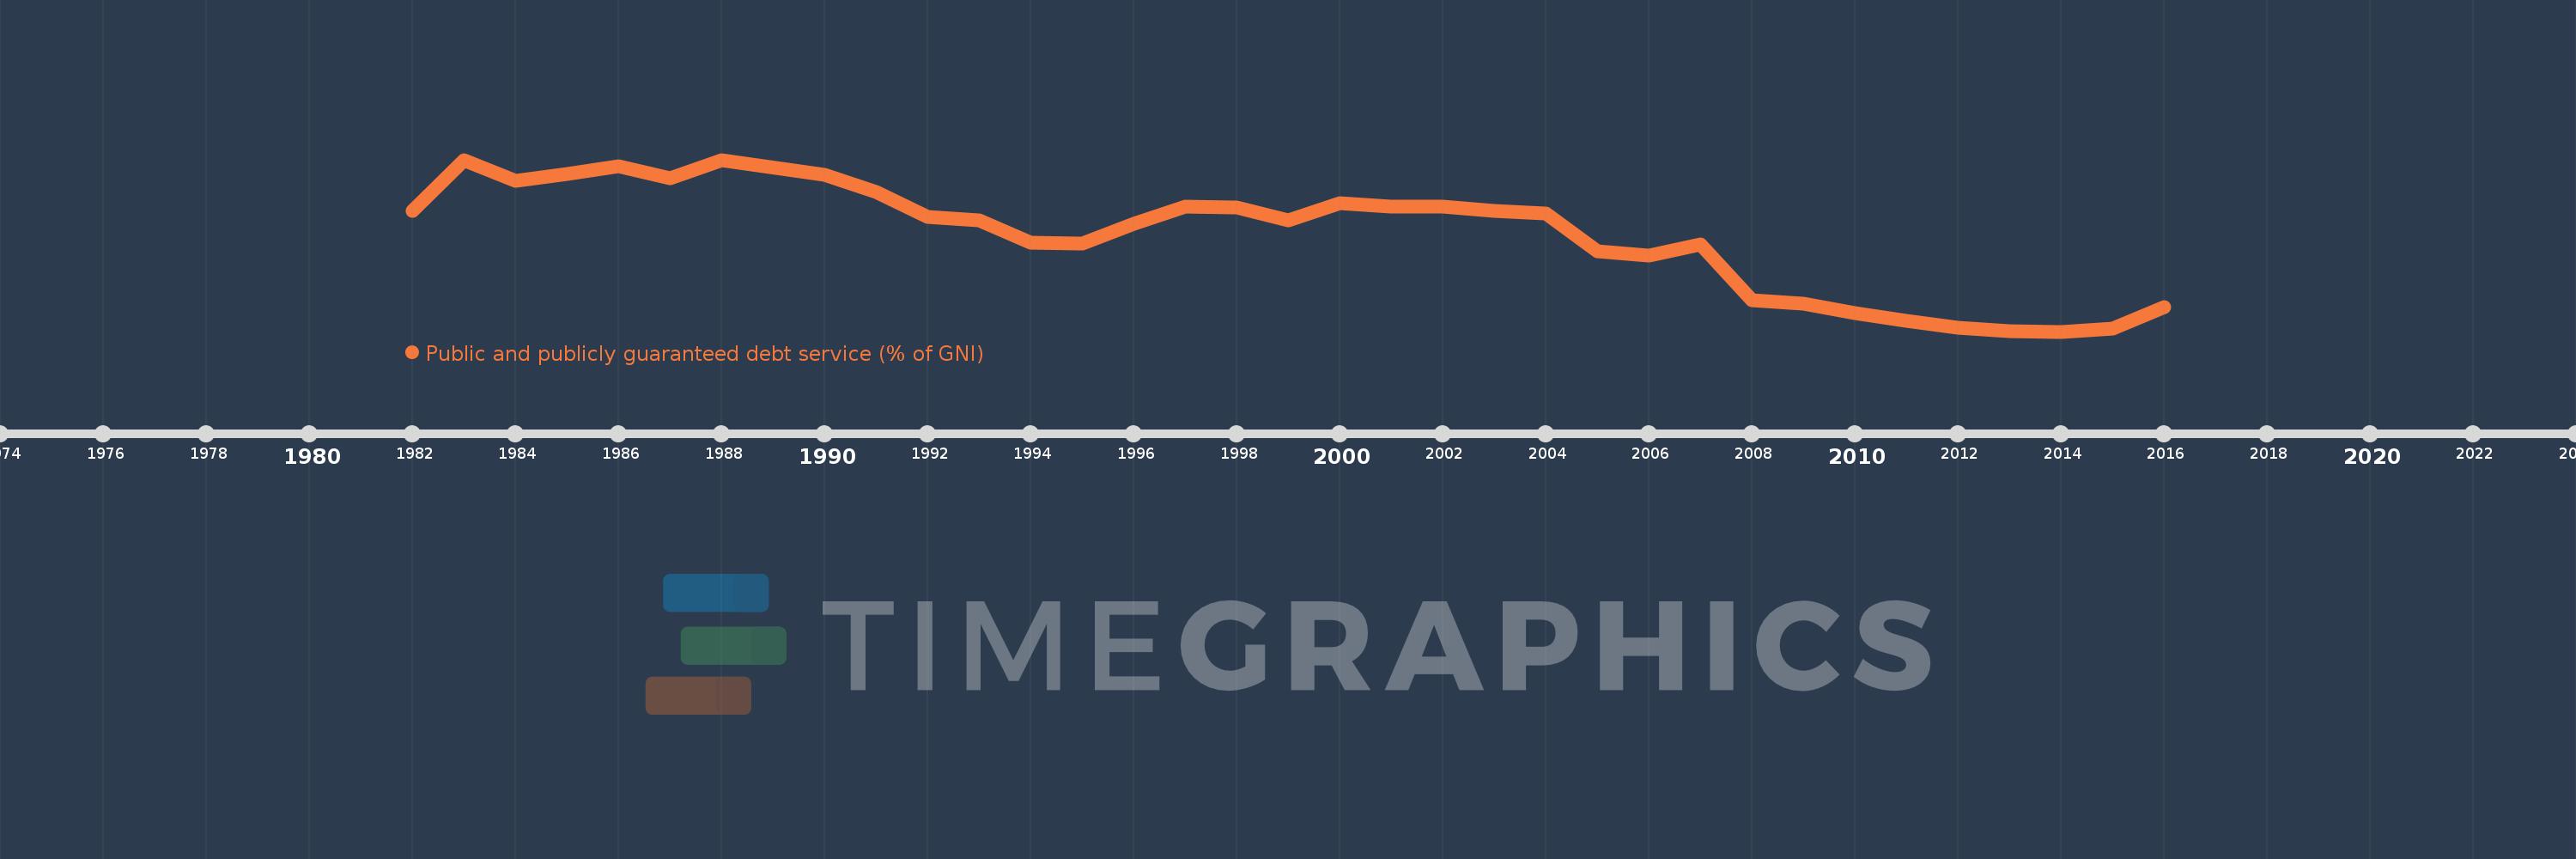
Public and publicly guaranteed debt service (% of GNI)
2016,2015,2014,2013,2012,2011,2010,2009,2008,2007,2006,2005,2004,2003,2002,2001,2000,1999,1998,1997,1996,1995,1994,1993,1992,1991,1990,1988,1987,1986,1985,1984,1983,1982
Queste statistiche in altri paesi:
Linea del tempo:
Questa scala temporale mostra un grafico dal 1982 anno al 2016 anno. Upper middle income. I dati fino ad 1981 anno non disponibili. Il numero di osservazioni attuali secondo i date: 34.
La fonte (nome):
Indicatori dello sviluppo mondiale
La fonte (organizzazione):
World Bank, International Debt Statistics.
Categorie:
External Debt
sono stati aggiornati
23 apr 2017 anni
Indicatori delle variazioni dei valori per anni
Minima:
0.728
1 gen 2014 anni
Massimo:
3.727
1 gen 1983 anni
Alla data di osservazione
Valore
Variazione assoluta
La variazione rispetto al valore precedente
1 gen 1982 anni
2.832
+2.832
0.0%
1 gen 1983 anni
3.727
+0.896
31.62%
1 gen 1984 anni
3.364
-0.364
-9.75%
1 gen 1985 anni
3.481
+0.117
3.49%
1 gen 1986 anni
3.619
+0.138
3.95%
1 gen 1987 anni
3.404
-0.214
-5.92%
1 gen 1988 anni
3.724
+0.319
9.37%
1 gen 1990 anni
3.458
-0.266
-7.14%
1 gen 1991 anni
3.17
-0.288
-8.32%
1 gen 1992 anni
2.734
-0.436
-13.76%
1 gen 1993 anni
2.665
-0.069
-2.53%
1 gen 1994 anni
2.275
-0.389
-14.61%
1 gen 1995 anni
2.263
-0.013
-0.56%
1 gen 1996 anni
2.613
+0.35
15.48%
1 gen 1997 anni
2.914
+0.301
11.53%
1 gen 1998 anni
2.892
-0.023
-0.77%
1 gen 1999 anni
2.664
-0.228
-7.88%
1 gen 2000 anni
2.976
+0.312
11.71%
1 gen 2001 anni
2.904
-0.072
-2.41%
1 gen 2002 anni
2.915
+0.011
0.39%
1 gen 2003 anni
2.833
-0.083
-2.84%
1 gen 2004 anni
2.795
-0.037
-1.32%
1 gen 2005 anni
2.132
-0.663
-23.72%
1 gen 2006 anni
2.059
-0.074
-3.45%
1 gen 2007 anni
2.247
+0.188
9.15%
1 gen 2008 anni
1.282
-0.965
-42.94%
1 gen 2009 anni
1.208
-0.074
-5.76%
1 gen 2010 anni
1.044
-0.164
-13.6%
1 gen 2011 anni
0.919
-0.125
-11.95%
1 gen 2012 anni
0.796
-0.123
-13.41%
1 gen 2013 anni
0.734
-0.062
-7.77%
1 gen 2014 anni
0.728
-0.006
-0.8%
1 gen 2015 anni
0.781
+0.053
7.3%
1 gen 2016 anni
1.148
+0.367
46.97%
Classificazione dei paesi secondo i statistiche attuali per anni


Commenti: