29
/it/
it
AIzaSyAYiBZKx7MnpbEhh9jyipgxe19OcubqV5w
April 1, 2024
143508
Grenada
GRD
true
2
1
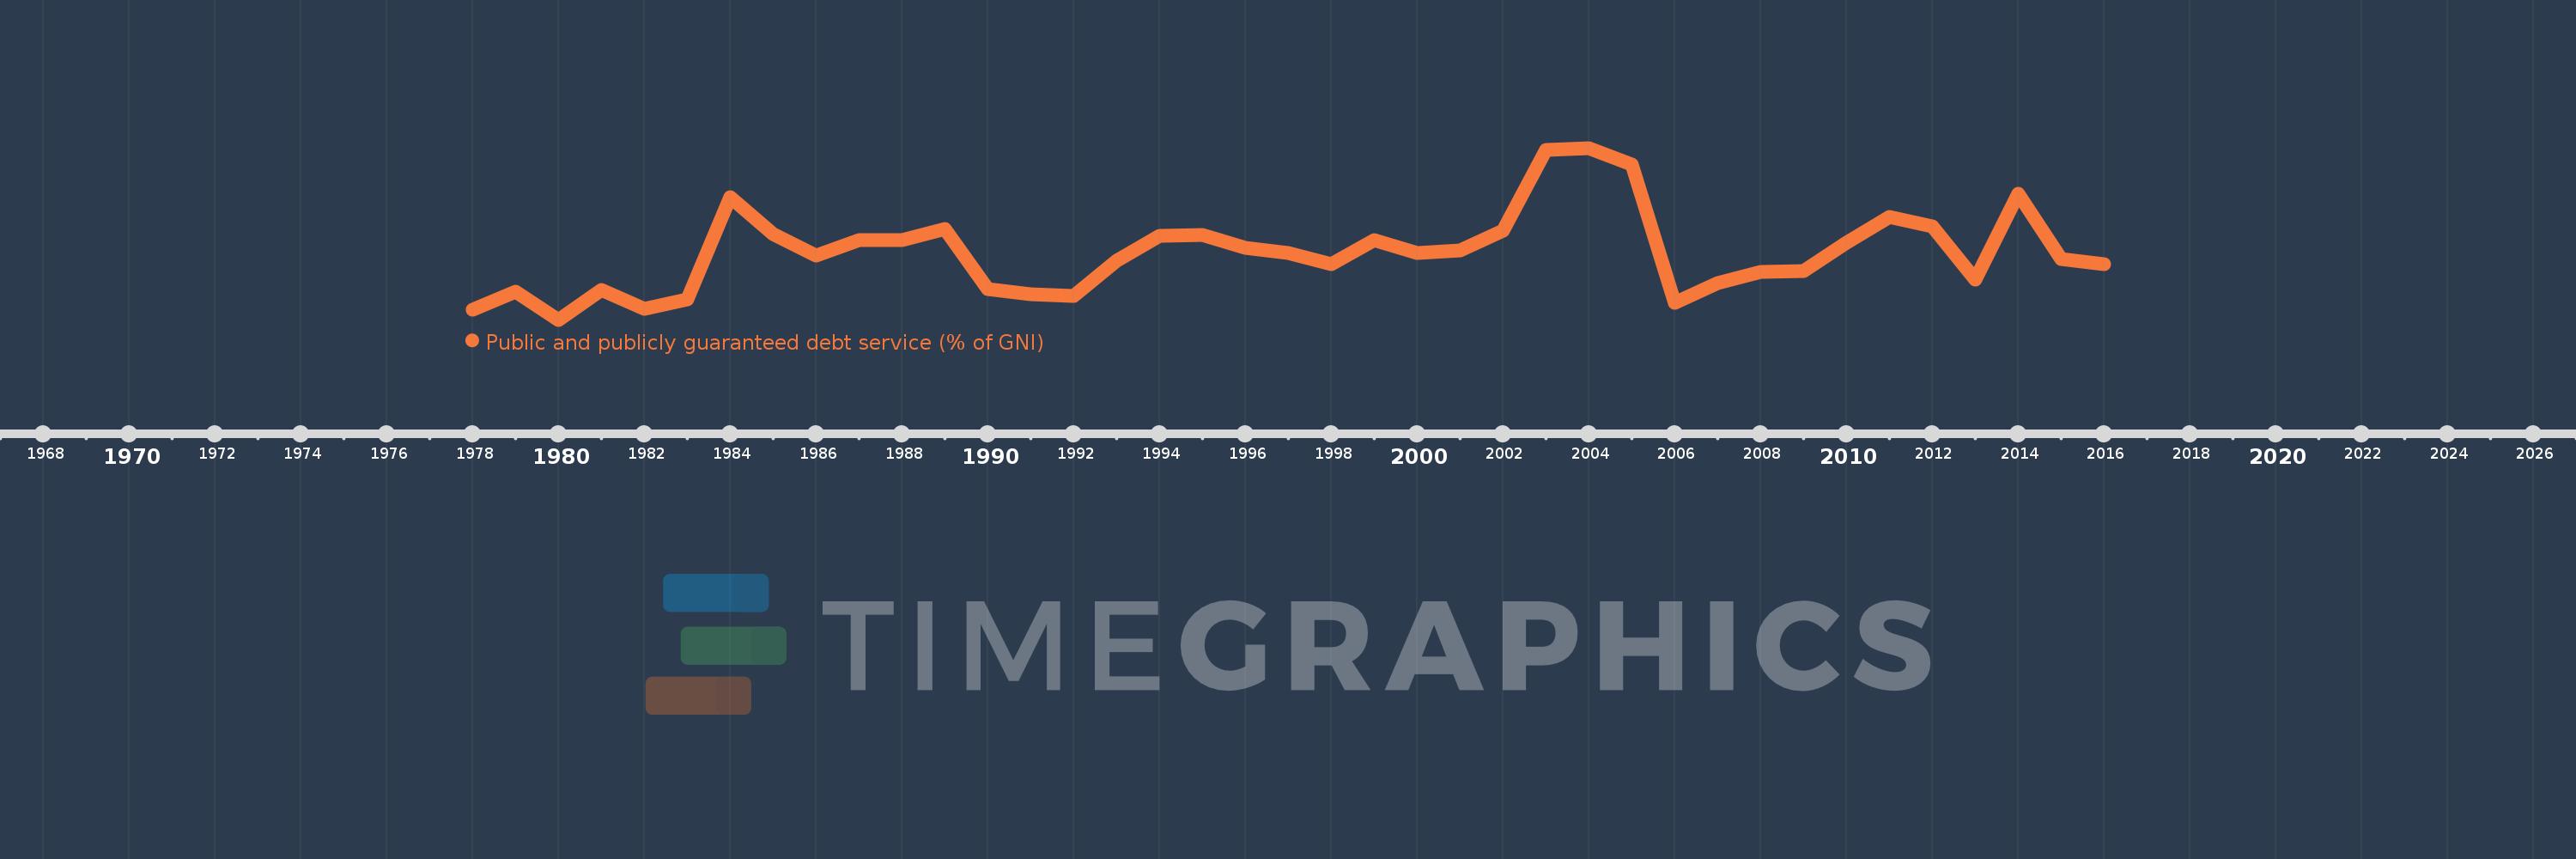
Public and publicly guaranteed debt service (% of GNI)
2016,2015,2014,2013,2012,2011,2010,2009,2008,2007,2006,2005,2004,2003,2002,2001,2000,1999,1998,1997,1996,1995,1994,1993,1992,1991,1990,1989,1988,1987,1986,1985,1984,1983,1982,1981,1980,1979,1978
Queste statistiche in altri paesi:
Linea del tempo:
Questa scala temporale mostra un grafico dal 1978 anno al 2016 anno. Grenada. I dati fino ad 1977 anno non disponibili. Il numero di osservazioni attuali secondo i date: 39.
La fonte (nome):
Indicatori dello sviluppo mondiale
La fonte (organizzazione):
World Bank, International Debt Statistics.
Categorie:
External Debt
sono stati aggiornati
23 apr 2017 anni
Indicatori delle variazioni dei valori per anni
Minima:
0.88
1 gen 1980 anni
Massimo:
5.595
1 gen 2004 anni
Alla data di osservazione
Valore
Variazione assoluta
La variazione rispetto al valore precedente
1 gen 1978 anni
1.164
+1.164
0.0%
1 gen 1979 anni
1.656
+0.492
42.24%
1 gen 1980 anni
0.88
-0.776
-46.86%
1 gen 1981 anni
1.69
+0.81
92.08%
1 gen 1982 anni
1.184
-0.507
-29.99%
1 gen 1983 anni
1.43
+0.246
20.8%
1 gen 1984 anni
4.234
+2.804
196.15%
1 gen 1985 anni
3.229
-1.005
-23.73%
1 gen 1986 anni
2.651
-0.579
-17.92%
1 gen 1987 anni
3.065
+0.415
15.64%
1 gen 1988 anni
3.059
-0.006
-0.21%
1 gen 1989 anni
3.378
+0.319
10.44%
1 gen 1990 anni
1.712
-1.666
-49.32%
1 gen 1991 anni
1.569
-0.143
-8.37%
1 gen 1992 anni
1.539
-0.03
-1.93%
1 gen 1993 anni
2.492
+0.953
61.94%
1 gen 1994 anni
3.184
+0.692
27.78%
1 gen 1995 anni
3.217
+0.034
1.06%
1 gen 1996 anni
2.842
-0.376
-11.68%
1 gen 1997 anni
2.702
-0.14
-4.92%
1 gen 1998 anni
2.403
-0.299
-11.06%
1 gen 1999 anni
3.054
+0.651
27.1%
1 gen 2000 anni
2.714
-0.341
-11.15%
1 gen 2001 anni
2.781
+0.067
2.47%
1 gen 2002 anni
3.336
+0.555
19.96%
1 gen 2003 anni
5.549
+2.213
66.33%
1 gen 2004 anni
5.595
+0.046
0.83%
1 gen 2005 anni
5.133
-0.462
-8.26%
1 gen 2006 anni
1.346
-3.787
-73.77%
1 gen 2007 anni
1.89
+0.544
40.39%
1 gen 2008 anni
2.202
+0.313
16.54%
1 gen 2009 anni
2.227
+0.024
1.1%
1 gen 2010 anni
3.0
+0.773
34.73%
1 gen 2011 anni
3.703
+0.703
23.42%
1 gen 2012 anni
3.44
-0.263
-7.1%
1 gen 2013 anni
1.981
-1.459
-42.42%
1 gen 2014 anni
4.35
+2.369
119.61%
1 gen 2015 anni
2.555
-1.795
-41.26%
1 gen 2016 anni
2.41
-0.145
-5.66%
Classificazione dei paesi secondo i statistiche attuali per anni


Commenti: