29
/it/
it
AIzaSyAYiBZKx7MnpbEhh9jyipgxe19OcubqV5w
April 1, 2024
148541
Guyana
GUY
true
2
1
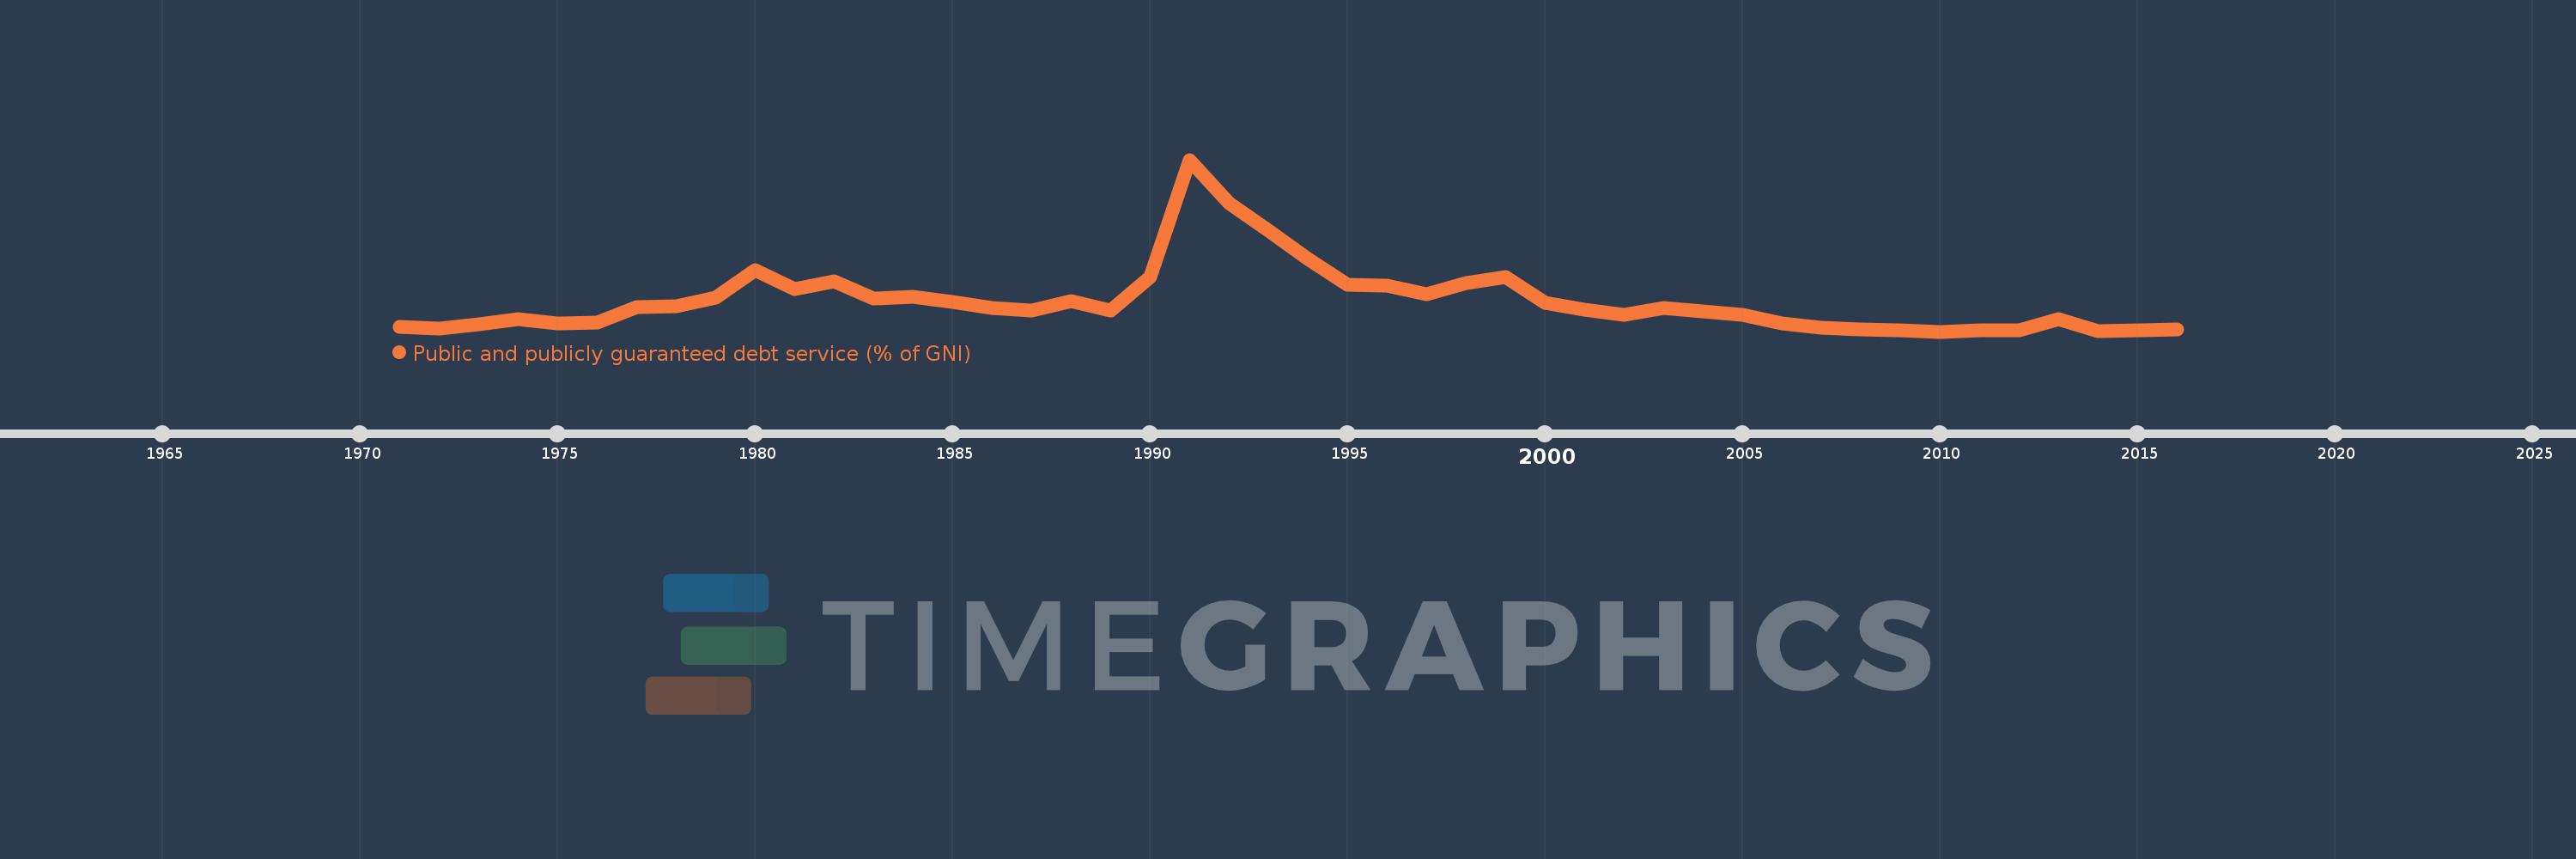
Public and publicly guaranteed debt service (% of GNI)
2016,2015,2014,2013,2012,2011,2010,2009,2008,2007,2006,2005,2004,2003,2002,2001,2000,1999,1998,1997,1996,1995,1994,1993,1992,1991,1990,1989,1988,1987,1986,1985,1984,1983,1982,1981,1980,1979,1978,1977,1976,1975,1974,1973,1972,1971
Queste statistiche in altri paesi:
Linea del tempo:
Questa scala temporale mostra un grafico dal 1971 anno al 2016 anno. Guyana. I dati fino ad 1970 anno non disponibili. Il numero di osservazioni attuali secondo i date: 46.
La fonte (nome):
Indicatori dello sviluppo mondiale
La fonte (organizzazione):
World Bank, International Debt Statistics.
Categorie:
External Debt
sono stati aggiornati
23 apr 2017 anni
Indicatori delle variazioni dei valori per anni
Minima:
0.923
1 gen 2010 anni
Massimo:
51.659
1 gen 1991 anni
Alla data di osservazione
Valore
Variazione assoluta
La variazione rispetto al valore precedente
1 gen 1971 anni
2.284
+2.284
0.0%
1 gen 1972 anni
1.894
-0.39
-17.06%
1 gen 1973 anni
3.206
+1.312
69.27%
1 gen 1974 anni
4.489
+1.284
40.04%
1 gen 1975 anni
3.396
-1.093
-24.36%
1 gen 1976 anni
3.54
+0.144
4.25%
1 gen 1977 anni
8.241
+4.7
132.76%
1 gen 1978 anni
8.291
+0.05
0.6%
1 gen 1979 anni
10.817
+2.527
30.48%
1 gen 1980 anni
18.959
+8.141
75.26%
1 gen 1981 anni
13.443
-5.516
-29.09%
1 gen 1982 anni
15.83
+2.387
17.76%
1 gen 1983 anni
10.798
-5.032
-31.79%
1 gen 1984 anni
11.207
+0.408
3.78%
1 gen 1985 anni
9.591
-1.616
-14.42%
1 gen 1986 anni
7.824
-1.766
-18.42%
1 gen 1987 anni
7.076
-0.748
-9.56%
1 gen 1988 anni
9.986
+2.91
41.13%
1 gen 1989 anni
7.162
-2.824
-28.28%
1 gen 1990 anni
16.933
+9.771
136.42%
1 gen 1991 anni
51.659
+34.726
205.08%
1 gen 1992 anni
38.835
-12.824
-24.82%
1 gen 1993 anni
30.684
-8.151
-20.99%
1 gen 1994 anni
22.298
-8.386
-27.33%
1 gen 1995 anni
14.796
-7.502
-33.64%
1 gen 1996 anni
14.444
-0.353
-2.38%
1 gen 1997 anni
11.973
-2.47
-17.1%
1 gen 1998 anni
15.223
+3.249
27.14%
1 gen 1999 anni
17.012
+1.79
11.76%
1 gen 2000 anni
9.543
-7.47
-43.91%
1 gen 2001 anni
7.333
-2.21
-23.16%
1 gen 2002 anni
5.785
-1.548
-21.11%
1 gen 2003 anni
7.92
+2.136
36.92%
1 gen 2004 anni
6.946
-0.974
-12.3%
1 gen 2005 anni
5.916
-1.03
-14.83%
1 gen 2006 anni
3.256
-2.659
-44.96%
1 gen 2007 anni
2.067
-1.189
-36.51%
1 gen 2008 anni
1.466
-0.601
-29.09%
1 gen 2009 anni
1.382
-0.084
-5.73%
1 gen 2010 anni
0.923
-0.459
-33.18%
1 gen 2011 anni
1.194
+0.271
29.33%
1 gen 2012 anni
1.291
+0.096
8.06%
1 gen 2013 anni
4.616
+3.325
257.66%
1 gen 2014 anni
1.166
-3.45
-74.73%
1 gen 2015 anni
1.294
+0.128
10.98%
1 gen 2016 anni
1.437
+0.143
11.02%
Classificazione dei paesi secondo i statistiche attuali per anni


Commenti: