29
/it/
it
AIzaSyAYiBZKx7MnpbEhh9jyipgxe19OcubqV5w
April 1, 2024
188425
Malaysia
MYS
true
2
1
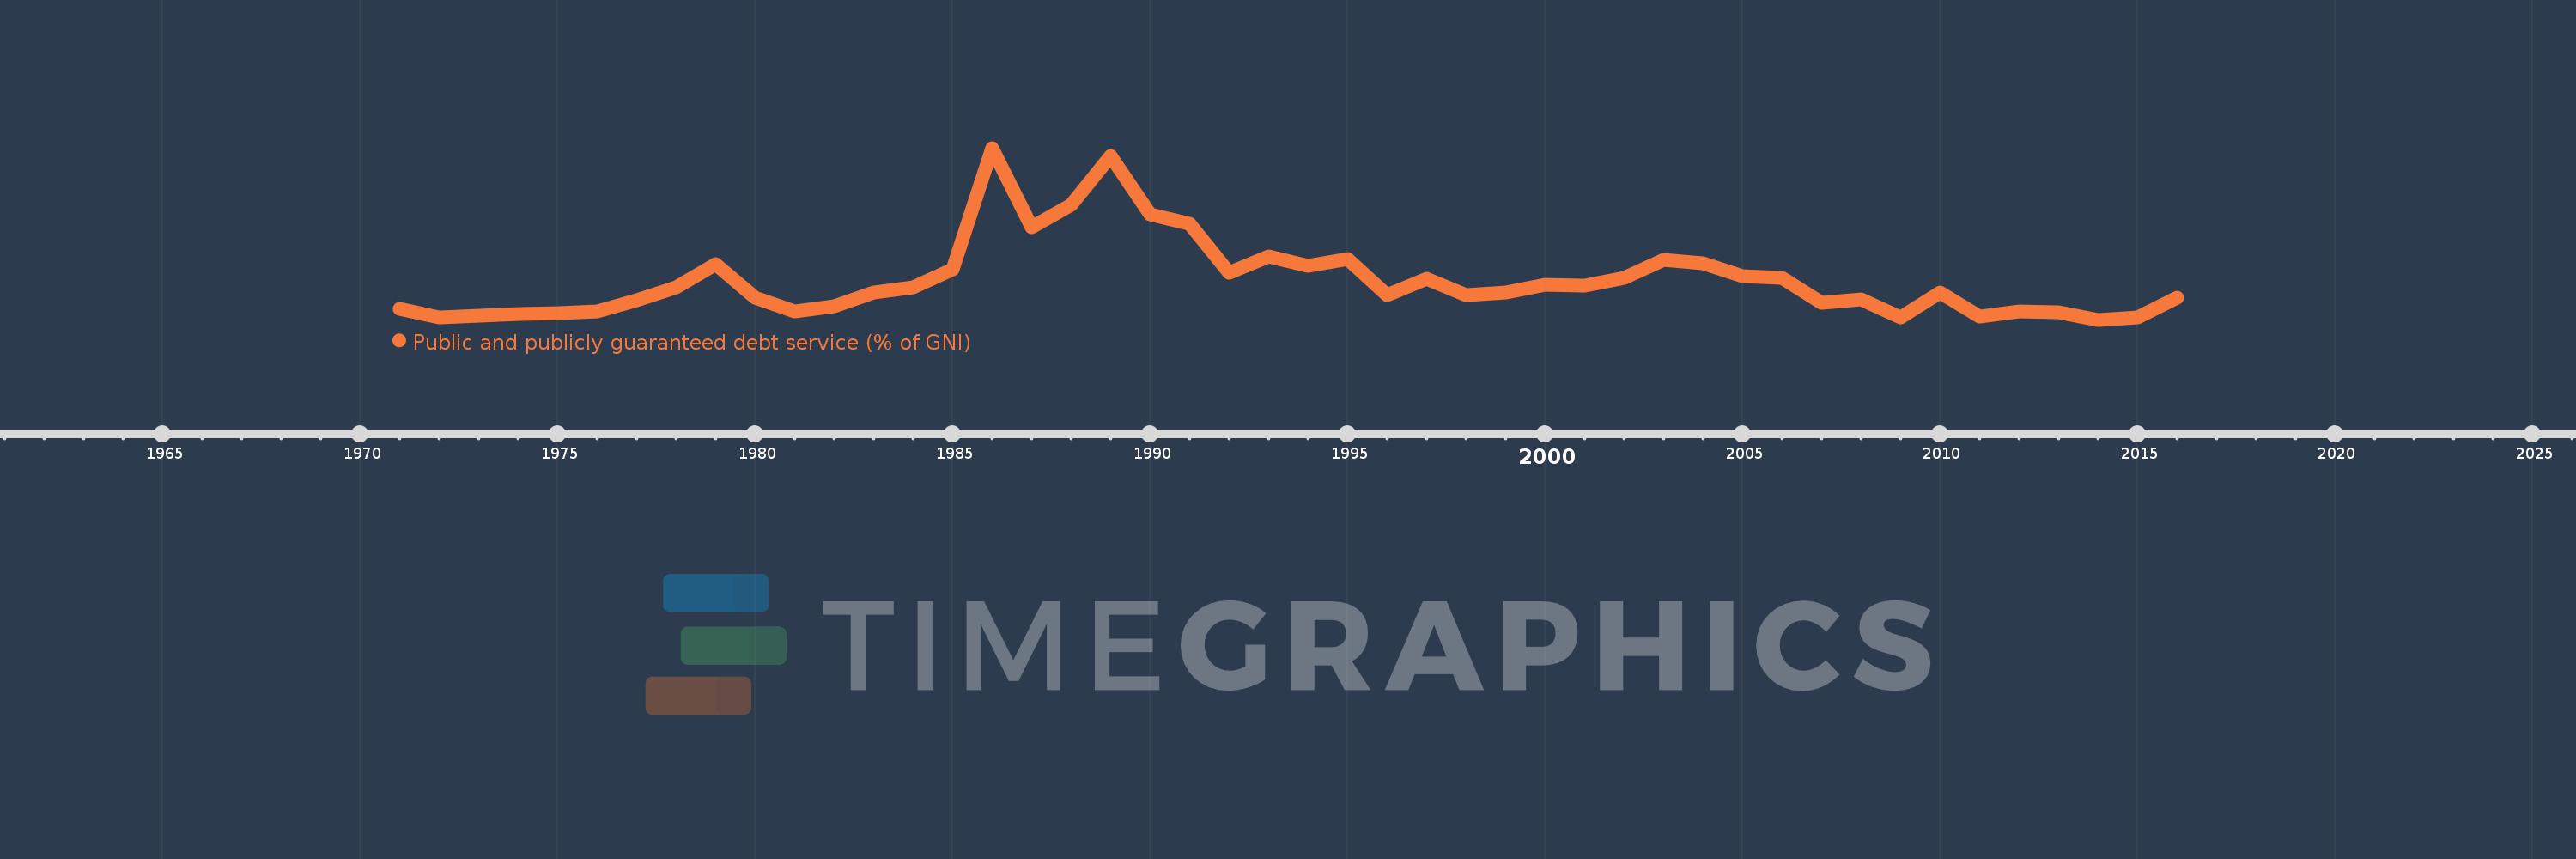
Public and publicly guaranteed debt service (% of GNI)
2016,2015,2014,2013,2012,2011,2010,2009,2008,2007,2006,2005,2004,2003,2002,2001,2000,1999,1998,1997,1996,1995,1994,1993,1992,1991,1990,1989,1988,1987,1986,1985,1984,1983,1982,1981,1980,1979,1978,1977,1976,1975,1974,1973,1972,1971
Queste statistiche in altri paesi:
Linea del tempo:
Questa scala temporale mostra un grafico dal 1971 anno al 2016 anno. Malaysia. I dati fino ad 1970 anno non disponibili. Il numero di osservazioni attuali secondo i date: 46.
La fonte (nome):
Indicatori dello sviluppo mondiale
La fonte (organizzazione):
World Bank, International Debt Statistics.
Categorie:
External Debt
sono stati aggiornati
23 apr 2017 anni
Indicatori delle variazioni dei valori per anni
Minima:
0.938
1 gen 2014 anni
Massimo:
14.832
1 gen 1986 anni
Alla data di osservazione
Valore
Variazione assoluta
La variazione rispetto al valore precedente
1 gen 1971 anni
1.826
+1.826
0.0%
1 gen 1972 anni
1.159
-0.667
-36.52%
1 gen 1973 anni
1.275
+0.115
9.96%
1 gen 1974 anni
1.428
+0.154
12.05%
1 gen 1975 anni
1.487
+0.059
4.11%
1 gen 1976 anni
1.644
+0.158
10.59%
1 gen 1977 anni
2.524
+0.879
53.47%
1 gen 1978 anni
3.525
+1.001
39.67%
1 gen 1979 anni
5.403
+1.878
53.27%
1 gen 1980 anni
2.719
-2.683
-49.67%
1 gen 1981 anni
1.594
-1.126
-41.39%
1 gen 1982 anni
2.038
+0.444
27.87%
1 gen 1983 anni
3.113
+1.075
52.74%
1 gen 1984 anni
3.58
+0.467
14.99%
1 gen 1985 anni
5.024
+1.445
40.36%
1 gen 1986 anni
14.832
+9.808
195.21%
1 gen 1987 anni
8.389
-6.443
-43.44%
1 gen 1988 anni
10.197
+1.808
21.55%
1 gen 1989 anni
14.161
+3.963
38.87%
1 gen 1990 anni
9.434
-4.727
-33.38%
1 gen 1991 anni
8.668
-0.766
-8.12%
1 gen 1992 anni
4.723
-3.946
-45.52%
1 gen 1993 anni
6.073
+1.351
28.6%
1 gen 1994 anni
5.318
-0.756
-12.44%
1 gen 1995 anni
5.816
+0.499
9.38%
1 gen 1996 anni
2.963
-2.853
-49.05%
1 gen 1997 anni
4.284
+1.321
44.57%
1 gen 1998 anni
2.927
-1.357
-31.68%
1 gen 1999 anni
3.127
+0.2
6.83%
1 gen 2000 anni
3.751
+0.625
19.98%
1 gen 2001 anni
3.684
-0.067
-1.79%
1 gen 2002 anni
4.331
+0.647
17.56%
1 gen 2003 anni
5.808
+1.477
34.09%
1 gen 2004 anni
5.532
-0.276
-4.76%
1 gen 2005 anni
4.457
-1.075
-19.43%
1 gen 2006 anni
4.343
-0.114
-2.55%
1 gen 2007 anni
2.294
-2.049
-47.19%
1 gen 2008 anni
2.553
+0.259
11.31%
1 gen 2009 anni
1.144
-1.41
-55.21%
1 gen 2010 anni
3.142
+1.998
174.68%
1 gen 2011 anni
1.169
-1.972
-62.78%
1 gen 2012 anni
1.59
+0.421
35.99%
1 gen 2013 anni
1.518
-0.072
-4.53%
1 gen 2014 anni
0.938
-0.58
-38.21%
1 gen 2015 anni
1.158
+0.22
23.4%
1 gen 2016 anni
2.702
+1.544
133.41%
Classificazione dei paesi secondo i statistiche attuali per anni


Commenti: