29
/it/
it
AIzaSyAYiBZKx7MnpbEhh9jyipgxe19OcubqV5w
April 1, 2024
55325
Pre-demographic dividend
PRE
false
2
1
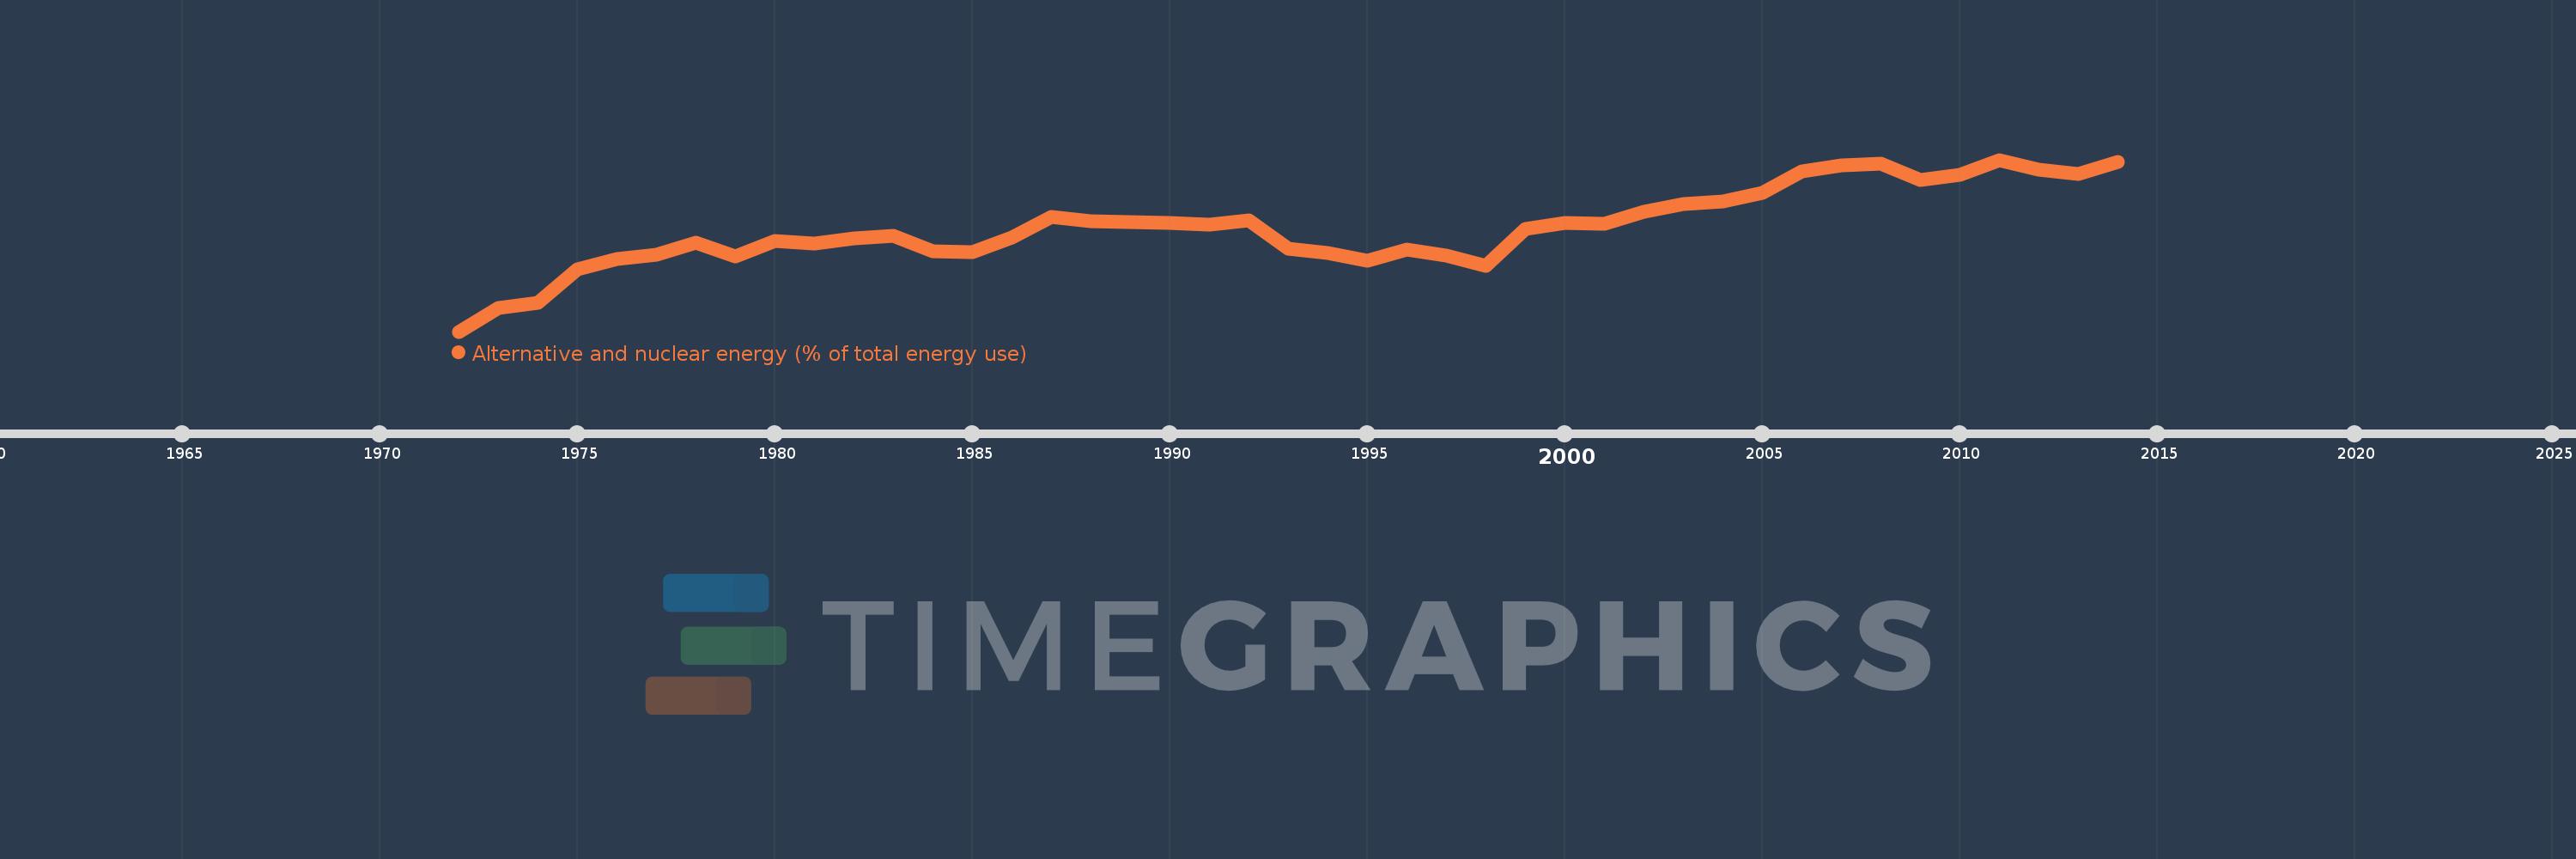
Alternative and nuclear energy (% of total energy use)
2014,2013,2012,2011,2010,2009,2008,2007,2006,2005,2004,2003,2002,2001,2000,1999,1998,1997,1996,1995,1994,1993,1992,1991,1990,1989,1988,1987,1986,1985,1984,1983,1982,1981,1980,1979,1978,1977,1976,1975,1974,1973,1972
Queste statistiche in altri paesi:
AlbaniaAlgeriaAngolaArab WorldArgentinaArmeniaAustraliaAustriaAzerbaijanBahrainBangladeshBelarusBelgiumBeninBoliviaBosnia and HerzegovinaBotswanaBrazilBrunei DarussalamBulgariaCambodiaCameroonCanadaCaribbean small statesCentral Europe and the BalticsChileChinaColombiaCongo, Dem. Rep.Congo, Rep.Costa RicaCote d'IvoireCroatiaCubaCuracaoCyprusCzech RepublicDenmarkDominican RepublicEarly-demographic dividendEast Asia & PacificEast Asia & Pacific (excluding high income)East Asia & Pacific (IDA & IBRD countries)EcuadorEgypt, Arab Rep.El SalvadorEritreaEstoniaEthiopiaEuro areaEurope & Central AsiaEurope & Central Asia (excluding high income)Europe & Central Asia (IDA & IBRD countries)European UnionFinlandFragile and conflict affected situationsFranceGabonGeorgiaGermanyGhanaGibraltarGreeceGuatemalaHaitiHeavily indebted poor countries (HIPC)High incomeHondurasHong Kong SAR, ChinaHungaryIBRD onlyIcelandIDA & IBRD totalIDA blendIDA onlyIDA totalIndiaIndonesiaIran, Islamic Rep.IraqIrelandIsraelItalyJamaicaJapanJordanKazakhstanKenyaKorea, Dem. People’s Rep.Korea, Rep.KosovoKuwaitKyrgyz RepublicLate-demographic dividendLatin America & Caribbean Latin America & Caribbean (excluding high income)Latin America & the Caribbean (IDA & IBRD countries)LatviaLeast developed countries: UN classificationLebanonLibyaLithuaniaLow & middle incomeLow incomeLower middle incomeLuxembourgMacedonia, FYRMalaysiaMaltaMauritiusMexicoMiddle East & North AfricaMiddle East & North Africa (excluding high income)Middle East & North Africa (IDA & IBRD countries)Middle incomeMoldovaMongoliaMontenegroMoroccoMozambiqueMyanmarNamibiaNepalNetherlandsNew ZealandNicaraguaNigerNigeriaNorth AmericaNorwayOECD membersOmanOther small statesPakistanPanamaParaguayPeruPhilippinesPolandPortugalPost-demographic dividendPre-demographic dividendQatarRomaniaRussian FederationSaudi ArabiaSenegalSerbiaSingaporeSlovak RepublicSloveniaSmall statesSouth AfricaSouth AsiaSouth Asia (IDA & IBRD)South SudanSpainSri LankaSub-Saharan Africa Sub-Saharan Africa (excluding high income)Sub-Saharan Africa (IDA & IBRD countries)SudanSwedenSwitzerlandSyrian Arab RepublicTajikistanTanzaniaThailandTogoTrinidad and TobagoTunisiaTurkeyTurkmenistanUkraineUnited Arab EmiratesUnited KingdomUnited StatesUpper middle incomeUruguayUzbekistanVenezuela, RBVietnamWorldYemen, Rep.ZambiaZimbabwe Linea del tempo:
Questa scala temporale mostra un grafico dal 1972 anno al 2014 anno. Pre-demographic dividend. I dati fino ad 1971 anno non disponibili. Il numero di osservazioni attuali secondo i date: 43.
La fonte (nome):
Indicatori dello sviluppo mondiale
La fonte (organizzazione):
IEA Statistics © OECD/IEA 2014 (http://www.iea.org/stats/index.asp), subject to https://www.iea.org/t&c/termsandconditions/
Categorie:
Energy & Mining
sono stati aggiornati
23 apr 2017 anni
Indicatori delle variazioni dei valori per anni
Minima:
0.907
1 gen 1972 anni
Massimo:
2.403
1 gen 2011 anni
Alla data di osservazione
Valore
Variazione assoluta
La variazione rispetto al valore precedente
1 gen 1972 anni
0.907
+0.907
0.0%
1 gen 1973 anni
1.112
+0.206
22.69%
1 gen 1974 anni
1.158
+0.045
4.09%
1 gen 1975 anni
1.453
+0.295
25.51%
1 gen 1976 anni
1.536
+0.083
5.71%
1 gen 1977 anni
1.58
+0.044
2.83%
1 gen 1978 anni
1.681
+0.101
6.4%
1 gen 1979 anni
1.56
-0.121
-7.2%
1 gen 1980 anni
1.698
+0.138
8.87%
1 gen 1981 anni
1.671
-0.027
-1.6%
1 gen 1982 anni
1.716
+0.044
2.65%
1 gen 1983 anni
1.738
+0.023
1.31%
1 gen 1984 anni
1.603
-0.135
-7.77%
1 gen 1985 anni
1.596
-0.007
-0.44%
1 gen 1986 anni
1.727
+0.131
8.2%
1 gen 1987 anni
1.902
+0.175
10.11%
1 gen 1988 anni
1.866
-0.036
-1.89%
1 gen 1989 anni
1.86
-0.006
-0.31%
1 gen 1990 anni
1.854
-0.005
-0.29%
1 gen 1991 anni
1.837
-0.017
-0.92%
1 gen 1992 anni
1.876
+0.039
2.1%
1 gen 1993 anni
1.628
-0.248
-13.2%
1 gen 1994 anni
1.595
-0.033
-2.03%
1 gen 1995 anni
1.523
-0.072
-4.53%
1 gen 1996 anni
1.622
+0.099
6.5%
1 gen 1997 anni
1.571
-0.051
-3.17%
1 gen 1998 anni
1.48
-0.091
-5.76%
1 gen 1999 anni
1.803
+0.323
21.81%
1 gen 2000 anni
1.855
+0.052
2.91%
1 gen 2001 anni
1.845
-0.011
-0.57%
1 gen 2002 anni
1.948
+0.103
5.61%
1 gen 2003 anni
2.02
+0.072
3.72%
1 gen 2004 anni
2.039
+0.018
0.91%
1 gen 2005 anni
2.114
+0.075
3.68%
1 gen 2006 anni
2.302
+0.188
8.9%
1 gen 2007 anni
2.353
+0.051
2.21%
1 gen 2008 anni
2.371
+0.018
0.76%
1 gen 2009 anni
2.229
-0.142
-5.98%
1 gen 2010 anni
2.27
+0.041
1.84%
1 gen 2011 anni
2.403
+0.133
5.86%
1 gen 2012 anni
2.317
-0.086
-3.57%
1 gen 2013 anni
2.276
-0.041
-1.77%
1 gen 2014 anni
2.387
+0.111
4.86%
Classificazione dei paesi secondo i statistiche attuali per anni


Commenti: