29
/it/
it
AIzaSyAYiBZKx7MnpbEhh9jyipgxe19OcubqV5w
April 1, 2024
141546
Greece
GRC
true
2
1
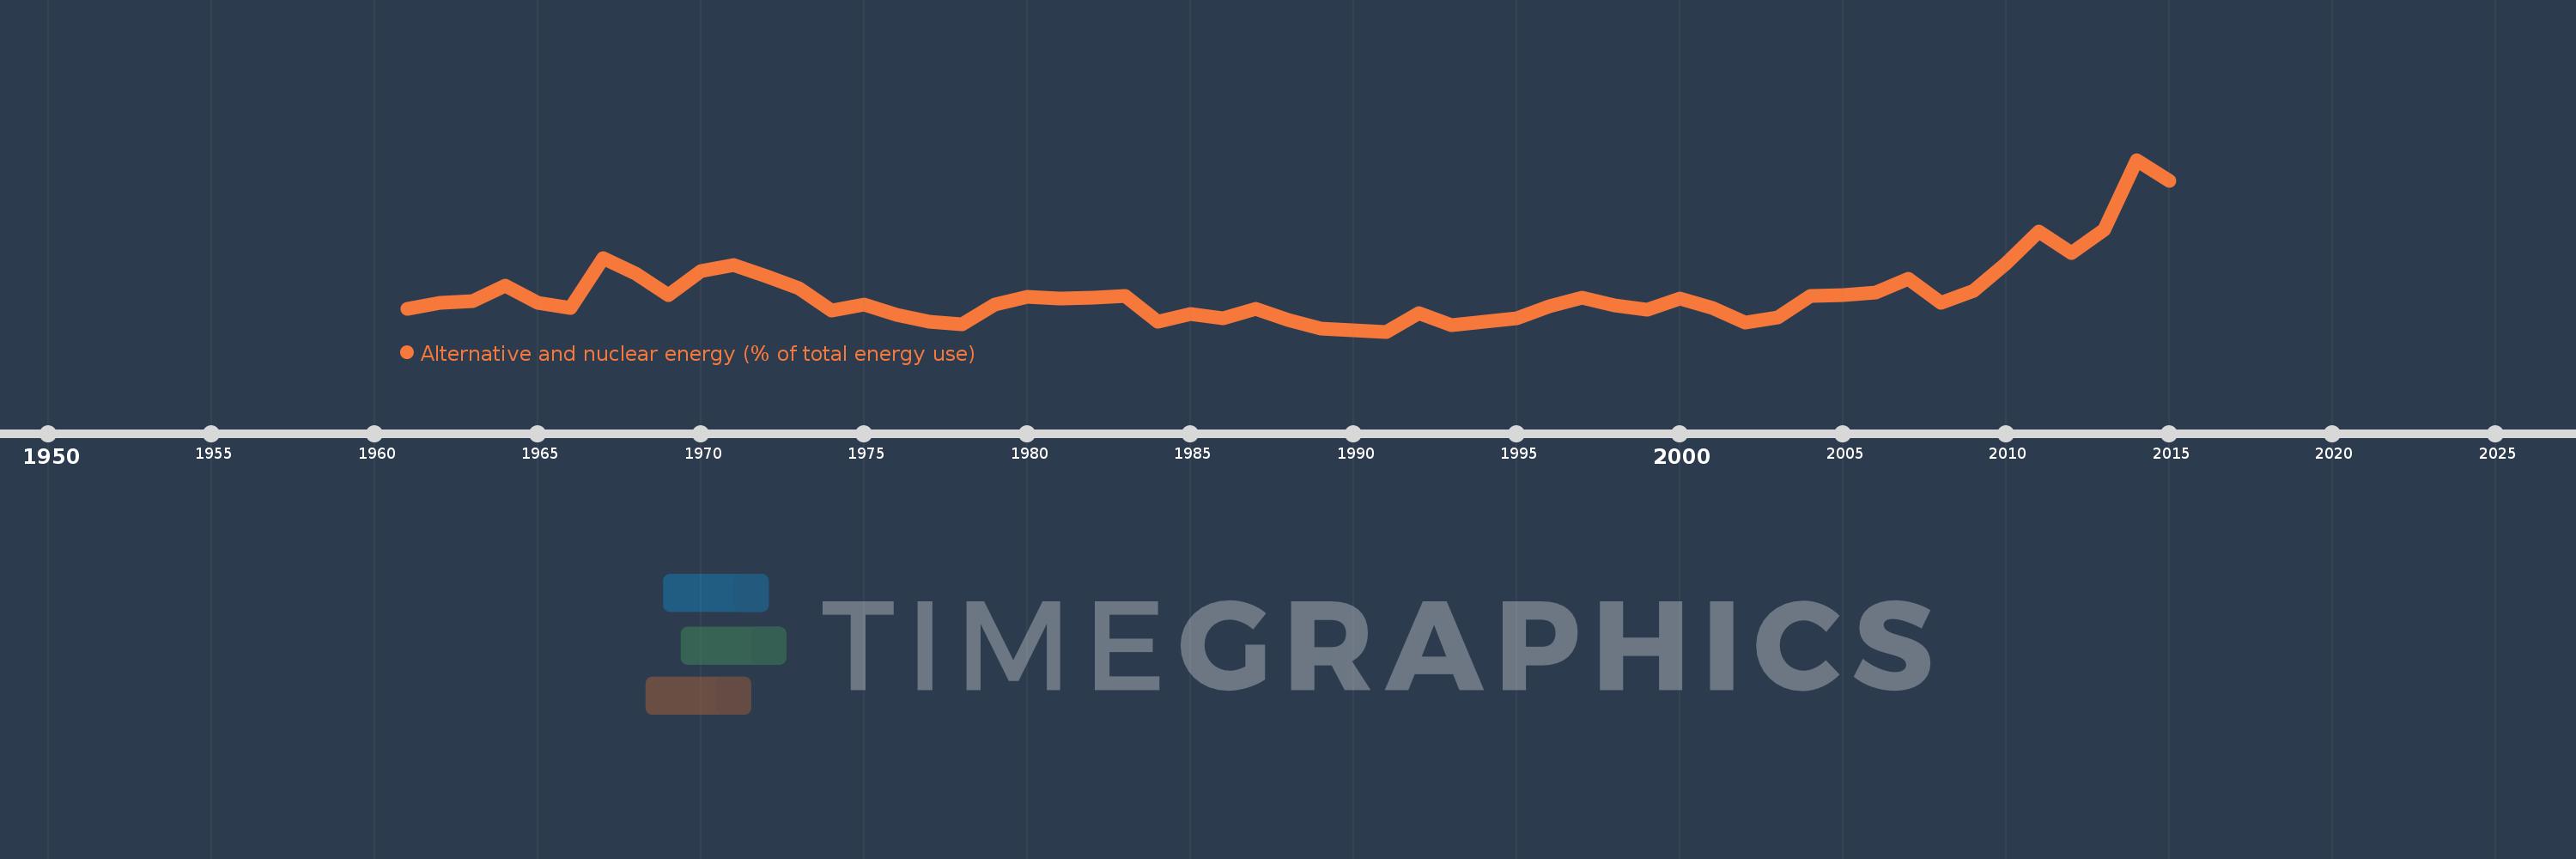
Alternative and nuclear energy (% of total energy use)
2015,2014,2013,2012,2011,2010,2009,2008,2007,2006,2005,2004,2003,2002,2001,2000,1999,1998,1997,1996,1995,1994,1993,1992,1991,1990,1989,1988,1987,1986,1985,1984,1983,1982,1981,1980,1979,1978,1977,1976,1975,1974,1973,1972,1971,1970,1969,1968,1967,1966,1965,1964,1963,1962,1961
Queste statistiche in altri paesi:
AlbaniaAlgeriaAngolaArab WorldArgentinaArmeniaAustraliaAustriaAzerbaijanBahrainBangladeshBelarusBelgiumBeninBoliviaBosnia and HerzegovinaBotswanaBrazilBrunei DarussalamBulgariaCambodiaCameroonCanadaCaribbean small statesCentral Europe and the BalticsChileChinaColombiaCongo, Dem. Rep.Congo, Rep.Costa RicaCote d'IvoireCroatiaCubaCuracaoCyprusCzech RepublicDenmarkDominican RepublicEarly-demographic dividendEast Asia & PacificEast Asia & Pacific (excluding high income)East Asia & Pacific (IDA & IBRD countries)EcuadorEgypt, Arab Rep.El SalvadorEritreaEstoniaEthiopiaEuro areaEurope & Central AsiaEurope & Central Asia (excluding high income)Europe & Central Asia (IDA & IBRD countries)European UnionFinlandFragile and conflict affected situationsFranceGabonGeorgiaGermanyGhanaGibraltarGreeceGuatemalaHaitiHeavily indebted poor countries (HIPC)High incomeHondurasHong Kong SAR, ChinaHungaryIBRD onlyIcelandIDA & IBRD totalIDA blendIDA onlyIDA totalIndiaIndonesiaIran, Islamic Rep.IraqIrelandIsraelItalyJamaicaJapanJordanKazakhstanKenyaKorea, Dem. People’s Rep.Korea, Rep.KosovoKuwaitKyrgyz RepublicLate-demographic dividendLatin America & Caribbean Latin America & Caribbean (excluding high income)Latin America & the Caribbean (IDA & IBRD countries)LatviaLeast developed countries: UN classificationLebanonLibyaLithuaniaLow & middle incomeLow incomeLower middle incomeLuxembourgMacedonia, FYRMalaysiaMaltaMauritiusMexicoMiddle East & North AfricaMiddle East & North Africa (excluding high income)Middle East & North Africa (IDA & IBRD countries)Middle incomeMoldovaMongoliaMontenegroMoroccoMozambiqueMyanmarNamibiaNepalNetherlandsNew ZealandNicaraguaNigerNigeriaNorth AmericaNorwayOECD membersOmanOther small statesPakistanPanamaParaguayPeruPhilippinesPolandPortugalPost-demographic dividendPre-demographic dividendQatarRomaniaRussian FederationSaudi ArabiaSenegalSerbiaSingaporeSlovak RepublicSloveniaSmall statesSouth AfricaSouth AsiaSouth Asia (IDA & IBRD)South SudanSpainSri LankaSub-Saharan Africa Sub-Saharan Africa (excluding high income)Sub-Saharan Africa (IDA & IBRD countries)SudanSwedenSwitzerlandSyrian Arab RepublicTajikistanTanzaniaThailandTogoTrinidad and TobagoTunisiaTurkeyTurkmenistanUkraineUnited Arab EmiratesUnited KingdomUnited StatesUpper middle incomeUruguayUzbekistanVenezuela, RBVietnamWorldYemen, Rep.ZambiaZimbabwe Linea del tempo:
Questa scala temporale mostra un grafico dal 1961 anno al 2015 anno. Greece. I dati fino ad 1960 anno non disponibili. Il numero di osservazioni attuali secondo i date: 55.
La fonte (nome):
Indicatori dello sviluppo mondiale
La fonte (organizzazione):
IEA Statistics © OECD/IEA 2014 (http://www.iea.org/stats/index.asp), subject to https://www.iea.org/t&c/termsandconditions/
Categorie:
Energy & Mining
sono stati aggiornati
23 apr 2017 anni
Indicatori delle variazioni dei valori per anni
Minima:
0.986
1 gen 1991 anni
Massimo:
6.076
1 gen 2014 anni
Alla data di osservazione
Valore
Variazione assoluta
La variazione rispetto al valore precedente
1 gen 1961 anni
1.66
+1.66
0.0%
1 gen 1962 anni
1.845
+0.184
11.11%
1 gen 1963 anni
1.878
+0.033
1.81%
1 gen 1964 anni
2.336
+0.457
24.34%
1 gen 1965 anni
1.841
-0.494
-21.16%
1 gen 1966 anni
1.683
-0.158
-8.61%
1 gen 1967 anni
3.157
+1.474
87.58%
1 gen 1968 anni
2.705
-0.451
-14.3%
1 gen 1969 anni
2.064
-0.641
-23.7%
1 gen 1970 anni
2.777
+0.713
34.52%
1 gen 1971 anni
2.954
+0.177
6.39%
1 gen 1972 anni
2.625
-0.329
-11.15%
1 gen 1973 anni
2.282
-0.342
-13.03%
1 gen 1974 anni
1.619
-0.664
-29.08%
1 gen 1975 anni
1.793
+0.174
10.75%
1 gen 1976 anni
1.476
-0.317
-17.69%
1 gen 1977 anni
1.269
-0.207
-14.01%
1 gen 1978 anni
1.208
-0.06
-4.77%
1 gen 1979 anni
1.786
+0.578
47.84%
1 gen 1980 anni
2.01
+0.224
12.52%
1 gen 1981 anni
1.955
-0.056
-2.76%
1 gen 1982 anni
2.001
+0.046
2.36%
1 gen 1983 anni
2.035
+0.034
1.72%
1 gen 1984 anni
1.278
-0.757
-37.19%
1 gen 1985 anni
1.505
+0.227
17.75%
1 gen 1986 anni
1.374
-0.131
-8.67%
1 gen 1987 anni
1.668
+0.293
21.33%
1 gen 1988 anni
1.335
-0.333
-19.96%
1 gen 1989 anni
1.066
-0.269
-20.15%
1 gen 1990 anni
1.019
-0.047
-4.42%
1 gen 1991 anni
0.986
-0.033
-3.25%
1 gen 1992 anni
1.539
+0.553
56.14%
1 gen 1993 anni
1.186
-0.353
-22.95%
1 gen 1994 anni
1.272
+0.086
7.24%
1 gen 1995 anni
1.377
+0.105
8.27%
1 gen 1996 anni
1.726
+0.349
25.34%
1 gen 1997 anni
1.989
+0.264
15.29%
1 gen 1998 anni
1.761
-0.228
-11.47%
1 gen 1999 anni
1.645
-0.116
-6.61%
1 gen 2000 anni
1.973
+0.328
19.97%
1 gen 2001 anni
1.686
-0.287
-14.53%
1 gen 2002 anni
1.243
-0.443
-26.29%
1 gen 2003 anni
1.402
+0.159
12.77%
1 gen 2004 anni
2.05
+0.649
46.27%
1 gen 2005 anni
2.072
+0.021
1.04%
1 gen 2006 anni
2.154
+0.083
3.99%
1 gen 2007 anni
2.551
+0.397
18.42%
1 gen 2008 anni
1.831
-0.72
-28.22%
1 gen 2009 anni
2.196
+0.365
19.95%
1 gen 2010 anni
3.016
+0.82
37.33%
1 gen 2011 anni
3.961
+0.945
31.33%
1 gen 2012 anni
3.321
-0.64
-16.16%
1 gen 2013 anni
3.996
+0.675
20.32%
1 gen 2014 anni
6.076
+2.08
52.04%
1 gen 2015 anni
5.456
-0.62
-10.2%
Classificazione dei paesi secondo i statistiche attuali per anni


Commenti: