29
/it/
it
AIzaSyAYiBZKx7MnpbEhh9jyipgxe19OcubqV5w
April 1, 2024
37945
IDA blend
IDB
false
2
1
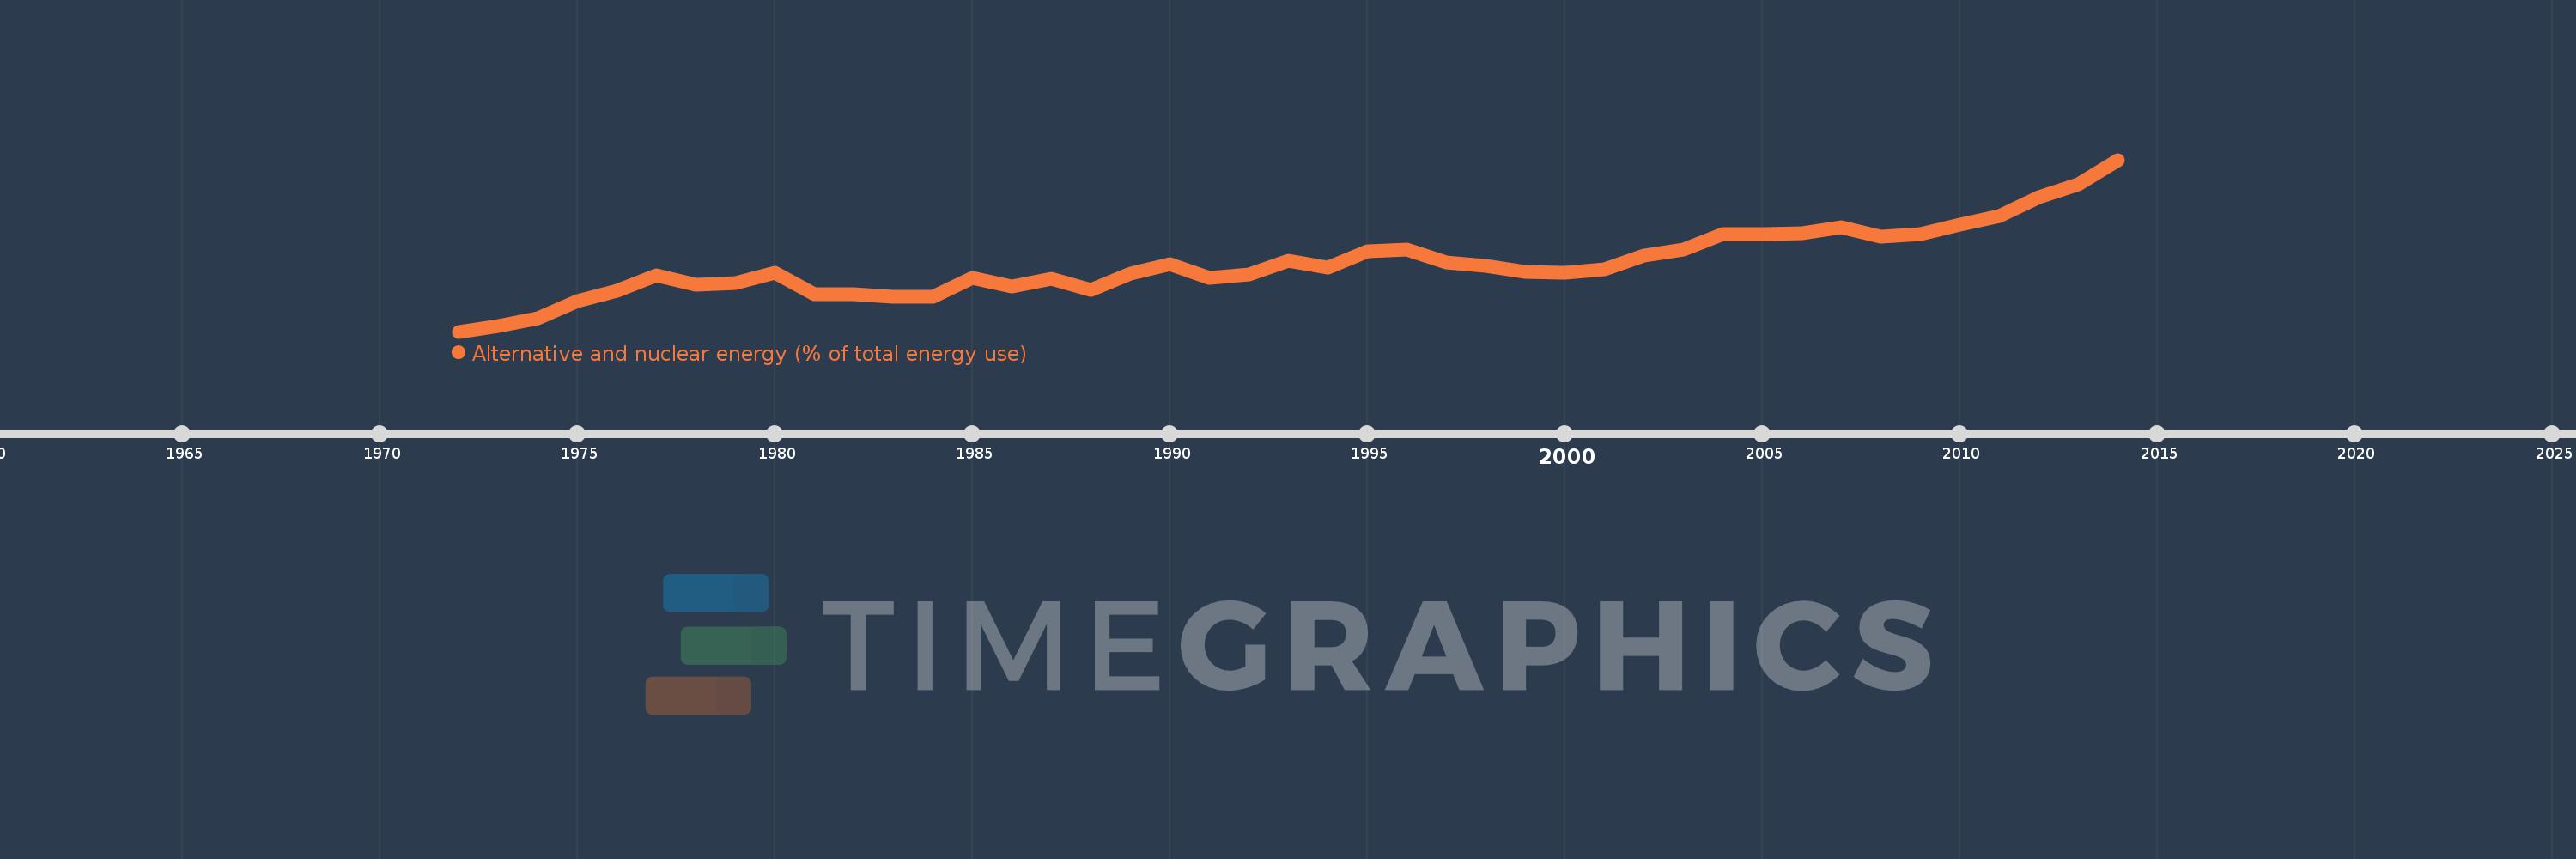
Alternative and nuclear energy (% of total energy use)
2014,2013,2012,2011,2010,2009,2008,2007,2006,2005,2004,2003,2002,2001,2000,1999,1998,1997,1996,1995,1994,1993,1992,1991,1990,1989,1988,1987,1986,1985,1984,1983,1982,1981,1980,1979,1978,1977,1976,1975,1974,1973,1972
Queste statistiche in altri paesi:
AlbaniaAlgeriaAngolaArab WorldArgentinaArmeniaAustraliaAustriaAzerbaijanBahrainBangladeshBelarusBelgiumBeninBoliviaBosnia and HerzegovinaBotswanaBrazilBrunei DarussalamBulgariaCambodiaCameroonCanadaCaribbean small statesCentral Europe and the BalticsChileChinaColombiaCongo, Dem. Rep.Congo, Rep.Costa RicaCote d'IvoireCroatiaCubaCuracaoCyprusCzech RepublicDenmarkDominican RepublicEarly-demographic dividendEast Asia & PacificEast Asia & Pacific (excluding high income)East Asia & Pacific (IDA & IBRD countries)EcuadorEgypt, Arab Rep.El SalvadorEritreaEstoniaEthiopiaEuro areaEurope & Central AsiaEurope & Central Asia (excluding high income)Europe & Central Asia (IDA & IBRD countries)European UnionFinlandFragile and conflict affected situationsFranceGabonGeorgiaGermanyGhanaGibraltarGreeceGuatemalaHaitiHeavily indebted poor countries (HIPC)High incomeHondurasHong Kong SAR, ChinaHungaryIBRD onlyIcelandIDA & IBRD totalIDA blendIDA onlyIDA totalIndiaIndonesiaIran, Islamic Rep.IraqIrelandIsraelItalyJamaicaJapanJordanKazakhstanKenyaKorea, Dem. People’s Rep.Korea, Rep.KosovoKuwaitKyrgyz RepublicLate-demographic dividendLatin America & Caribbean Latin America & Caribbean (excluding high income)Latin America & the Caribbean (IDA & IBRD countries)LatviaLeast developed countries: UN classificationLebanonLibyaLithuaniaLow & middle incomeLow incomeLower middle incomeLuxembourgMacedonia, FYRMalaysiaMaltaMauritiusMexicoMiddle East & North AfricaMiddle East & North Africa (excluding high income)Middle East & North Africa (IDA & IBRD countries)Middle incomeMoldovaMongoliaMontenegroMoroccoMozambiqueMyanmarNamibiaNepalNetherlandsNew ZealandNicaraguaNigerNigeriaNorth AmericaNorwayOECD membersOmanOther small statesPakistanPanamaParaguayPeruPhilippinesPolandPortugalPost-demographic dividendPre-demographic dividendQatarRomaniaRussian FederationSaudi ArabiaSenegalSerbiaSingaporeSlovak RepublicSloveniaSmall statesSouth AfricaSouth AsiaSouth Asia (IDA & IBRD)South SudanSpainSri LankaSub-Saharan Africa Sub-Saharan Africa (excluding high income)Sub-Saharan Africa (IDA & IBRD countries)SudanSwedenSwitzerlandSyrian Arab RepublicTajikistanTanzaniaThailandTogoTrinidad and TobagoTunisiaTurkeyTurkmenistanUkraineUnited Arab EmiratesUnited KingdomUnited StatesUpper middle incomeUruguayUzbekistanVenezuela, RBVietnamWorldYemen, Rep.ZambiaZimbabwe Linea del tempo:
Questa scala temporale mostra un grafico dal 1972 anno al 2014 anno. IDA blend. I dati fino ad 1971 anno non disponibili. Il numero di osservazioni attuali secondo i date: 43.
La fonte (nome):
Indicatori dello sviluppo mondiale
La fonte (organizzazione):
IEA Statistics © OECD/IEA 2014 (http://www.iea.org/stats/index.asp), subject to https://www.iea.org/t&c/termsandconditions/
Categorie:
Energy & Mining
sono stati aggiornati
23 apr 2017 anni
Indicatori delle variazioni dei valori per anni
Minima:
1.279
1 gen 1972 anni
Massimo:
3.269
1 gen 2014 anni
Alla data di osservazione
Valore
Variazione assoluta
La variazione rispetto al valore precedente
1 gen 1972 anni
1.279
+1.279
0.0%
1 gen 1973 anni
1.346
+0.067
5.2%
1 gen 1974 anni
1.438
+0.092
6.86%
1 gen 1975 anni
1.637
+0.199
13.82%
1 gen 1976 anni
1.75
+0.113
6.89%
1 gen 1977 anni
1.929
+0.179
10.24%
1 gen 1978 anni
1.82
-0.108
-5.62%
1 gen 1979 anni
1.842
+0.022
1.22%
1 gen 1980 anni
1.96
+0.118
6.38%
1 gen 1981 anni
1.708
-0.252
-12.85%
1 gen 1982 anni
1.707
-0.002
-0.09%
1 gen 1983 anni
1.68
-0.026
-1.54%
1 gen 1984 anni
1.685
+0.005
0.28%
1 gen 1985 anni
1.901
+0.216
12.84%
1 gen 1986 anni
1.801
-0.1
-5.28%
1 gen 1987 anni
1.887
+0.086
4.78%
1 gen 1988 anni
1.759
-0.128
-6.76%
1 gen 1989 anni
1.952
+0.192
10.94%
1 gen 1990 anni
2.056
+0.104
5.32%
1 gen 1991 anni
1.896
-0.159
-7.76%
1 gen 1992 anni
1.945
+0.049
2.58%
1 gen 1993 anni
2.095
+0.149
7.68%
1 gen 1994 anni
2.02
-0.075
-3.56%
1 gen 1995 anni
2.205
+0.185
9.16%
1 gen 1996 anni
2.229
+0.024
1.08%
1 gen 1997 anni
2.077
-0.152
-6.82%
1 gen 1998 anni
2.045
-0.032
-1.53%
1 gen 1999 anni
1.97
-0.075
-3.69%
1 gen 2000 anni
1.956
-0.014
-0.72%
1 gen 2001 anni
2.003
+0.047
2.4%
1 gen 2002 anni
2.163
+0.161
8.03%
1 gen 2003 anni
2.229
+0.065
3.02%
1 gen 2004 anni
2.406
+0.177
7.94%
1 gen 2005 anni
2.406
+0.0
0.02%
1 gen 2006 anni
2.415
+0.009
0.36%
1 gen 2007 anni
2.487
+0.072
2.97%
1 gen 2008 anni
2.376
-0.111
-4.47%
1 gen 2009 anni
2.406
+0.03
1.28%
1 gen 2010 anni
2.519
+0.113
4.7%
1 gen 2011 anni
2.613
+0.094
3.72%
1 gen 2012 anni
2.835
+0.223
8.52%
1 gen 2013 anni
2.989
+0.153
5.41%
1 gen 2014 anni
3.269
+0.28
9.36%
Classificazione dei paesi secondo i statistiche attuali per anni


Commenti: