29
/it/
it
AIzaSyAYiBZKx7MnpbEhh9jyipgxe19OcubqV5w
April 1, 2024
225619
Portugal
PRT
true
2
1
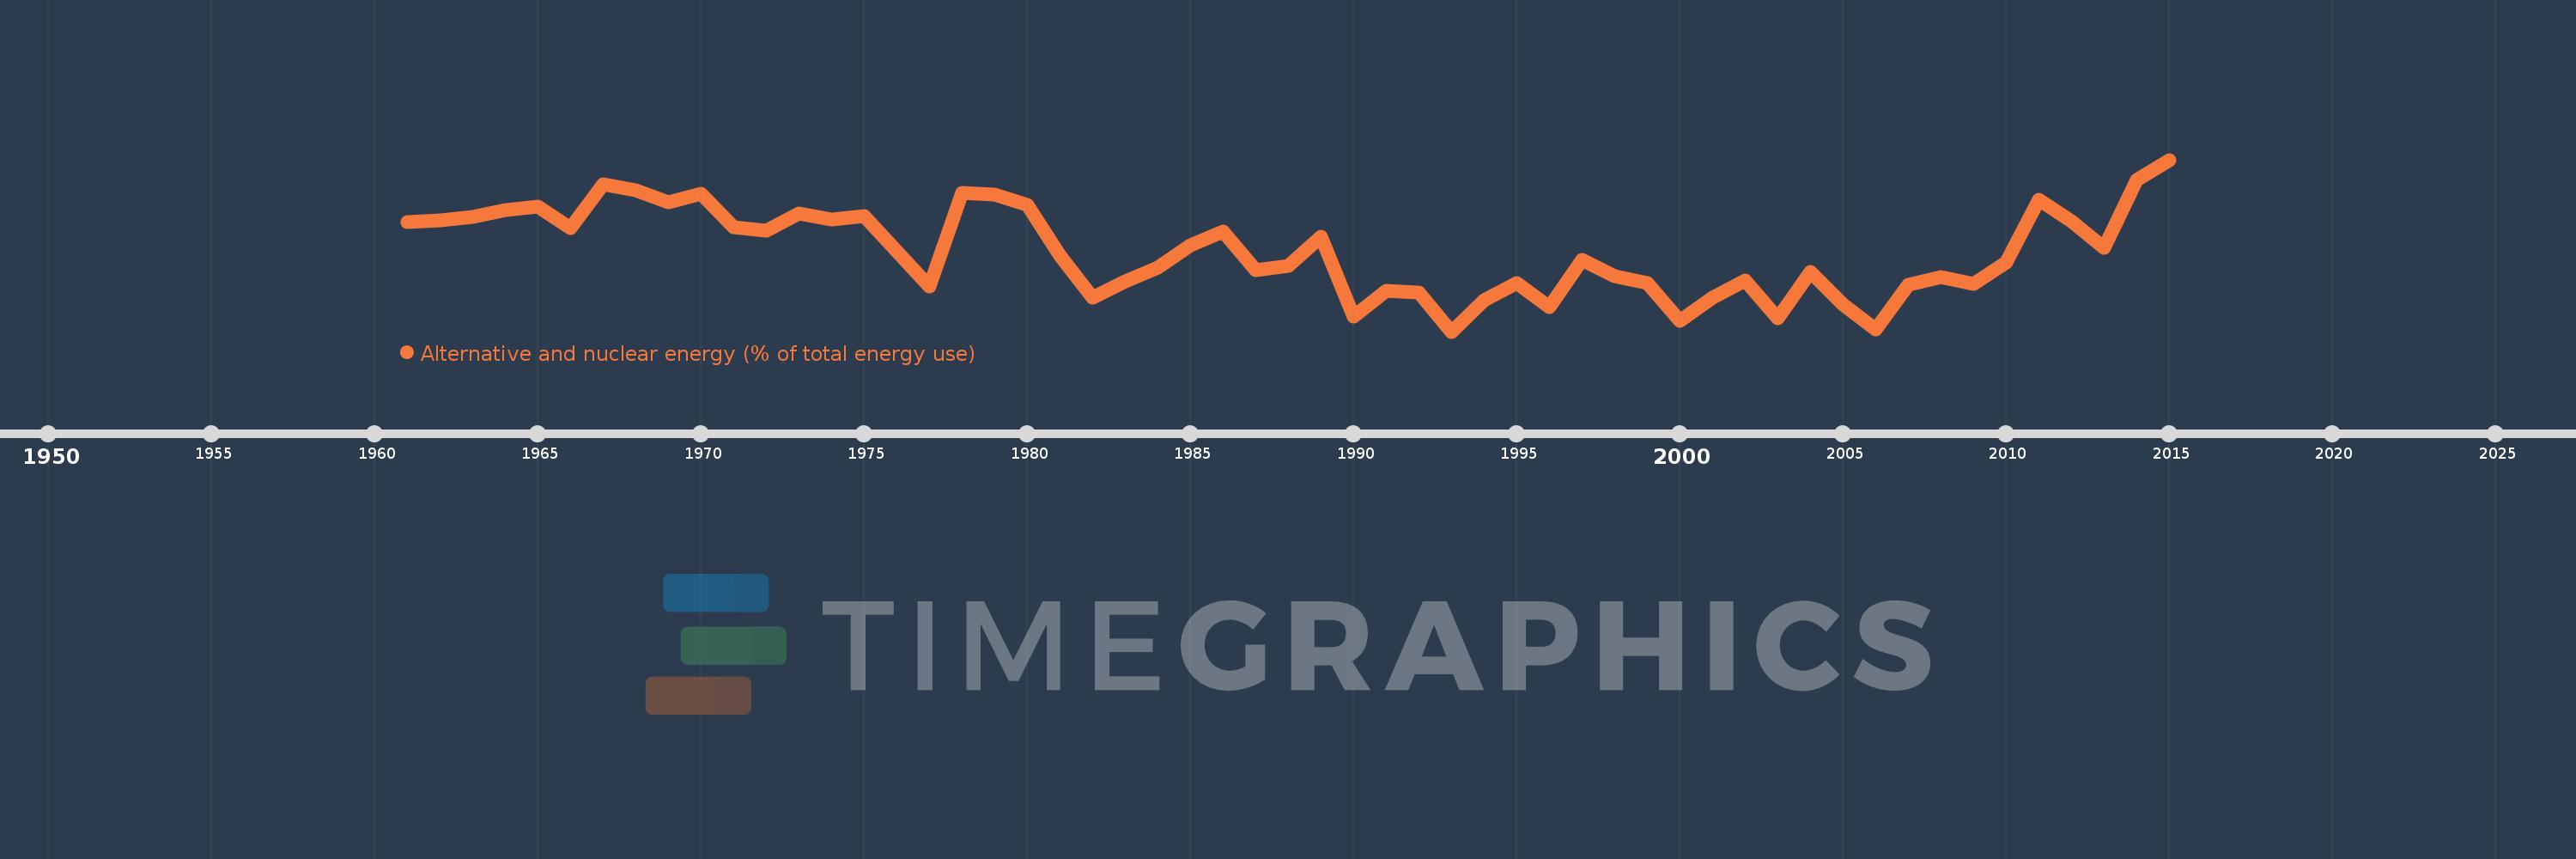
Alternative and nuclear energy (% of total energy use)
2015,2014,2013,2012,2011,2010,2009,2008,2007,2006,2005,2004,2003,2002,2001,2000,1999,1998,1997,1996,1995,1994,1993,1992,1991,1990,1989,1988,1987,1986,1985,1984,1983,1982,1981,1980,1979,1978,1977,1976,1975,1974,1973,1972,1971,1970,1969,1968,1967,1966,1965,1964,1963,1962,1961
Queste statistiche in altri paesi:
AlbaniaAlgeriaAngolaArab WorldArgentinaArmeniaAustraliaAustriaAzerbaijanBahrainBangladeshBelarusBelgiumBeninBoliviaBosnia and HerzegovinaBotswanaBrazilBrunei DarussalamBulgariaCambodiaCameroonCanadaCaribbean small statesCentral Europe and the BalticsChileChinaColombiaCongo, Dem. Rep.Congo, Rep.Costa RicaCote d'IvoireCroatiaCubaCuracaoCyprusCzech RepublicDenmarkDominican RepublicEarly-demographic dividendEast Asia & PacificEast Asia & Pacific (excluding high income)East Asia & Pacific (IDA & IBRD countries)EcuadorEgypt, Arab Rep.El SalvadorEritreaEstoniaEthiopiaEuro areaEurope & Central AsiaEurope & Central Asia (excluding high income)Europe & Central Asia (IDA & IBRD countries)European UnionFinlandFragile and conflict affected situationsFranceGabonGeorgiaGermanyGhanaGibraltarGreeceGuatemalaHaitiHeavily indebted poor countries (HIPC)High incomeHondurasHong Kong SAR, ChinaHungaryIBRD onlyIcelandIDA & IBRD totalIDA blendIDA onlyIDA totalIndiaIndonesiaIran, Islamic Rep.IraqIrelandIsraelItalyJamaicaJapanJordanKazakhstanKenyaKorea, Dem. People’s Rep.Korea, Rep.KosovoKuwaitKyrgyz RepublicLate-demographic dividendLatin America & Caribbean Latin America & Caribbean (excluding high income)Latin America & the Caribbean (IDA & IBRD countries)LatviaLeast developed countries: UN classificationLebanonLibyaLithuaniaLow & middle incomeLow incomeLower middle incomeLuxembourgMacedonia, FYRMalaysiaMaltaMauritiusMexicoMiddle East & North AfricaMiddle East & North Africa (excluding high income)Middle East & North Africa (IDA & IBRD countries)Middle incomeMoldovaMongoliaMontenegroMoroccoMozambiqueMyanmarNamibiaNepalNetherlandsNew ZealandNicaraguaNigerNigeriaNorth AmericaNorwayOECD membersOmanOther small statesPakistanPanamaParaguayPeruPhilippinesPolandPortugalPost-demographic dividendPre-demographic dividendQatarRomaniaRussian FederationSaudi ArabiaSenegalSerbiaSingaporeSlovak RepublicSloveniaSmall statesSouth AfricaSouth AsiaSouth Asia (IDA & IBRD)South SudanSpainSri LankaSub-Saharan Africa Sub-Saharan Africa (excluding high income)Sub-Saharan Africa (IDA & IBRD countries)SudanSwedenSwitzerlandSyrian Arab RepublicTajikistanTanzaniaThailandTogoTrinidad and TobagoTunisiaTurkeyTurkmenistanUkraineUnited Arab EmiratesUnited KingdomUnited StatesUpper middle incomeUruguayUzbekistanVenezuela, RBVietnamWorldYemen, Rep.ZambiaZimbabwe Linea del tempo:
Questa scala temporale mostra un grafico dal 1961 anno al 2015 anno. Portugal. I dati fino ad 1960 anno non disponibili. Il numero di osservazioni attuali secondo i date: 55.
La fonte (nome):
Indicatori dello sviluppo mondiale
La fonte (organizzazione):
IEA Statistics © OECD/IEA 2014 (http://www.iea.org/stats/index.asp), subject to https://www.iea.org/t&c/termsandconditions/
Categorie:
Energy & Mining
sono stati aggiornati
23 apr 2017 anni
Indicatori delle variazioni dei valori per anni
Minima:
2.314
1 gen 1993 anni
Massimo:
12.747
1 gen 2015 anni
Alla data di osservazione
Valore
Variazione assoluta
La variazione rispetto al valore precedente
1 gen 1961 anni
8.985
+8.985
0.0%
1 gen 1962 anni
9.059
+0.074
0.82%
1 gen 1963 anni
9.297
+0.238
2.63%
1 gen 1964 anni
9.711
+0.414
4.45%
1 gen 1965 anni
9.881
+0.171
1.76%
1 gen 1966 anni
8.617
-1.265
-12.8%
1 gen 1967 anni
11.246
+2.63
30.52%
1 gen 1968 anni
10.916
-0.33
-2.94%
1 gen 1969 anni
10.156
-0.759
-6.96%
1 gen 1970 anni
10.686
+0.529
5.21%
1 gen 1971 anni
8.662
-2.024
-18.94%
1 gen 1972 anni
8.455
-0.207
-2.39%
1 gen 1973 anni
9.474
+1.019
12.05%
1 gen 1974 anni
9.134
-0.34
-3.59%
1 gen 1975 anni
9.328
+0.194
2.12%
1 gen 1976 anni
7.171
-2.157
-23.13%
1 gen 1977 anni
5.044
-2.127
-29.66%
1 gen 1978 anni
10.722
+5.678
112.56%
1 gen 1979 anni
10.61
-0.112
-1.04%
1 gen 1980 anni
10.0
-0.611
-5.75%
1 gen 1981 anni
6.911
-3.088
-30.88%
1 gen 1982 anni
4.353
-2.558
-37.01%
1 gen 1983 anni
5.365
+1.012
23.25%
1 gen 1984 anni
6.2
+0.835
15.56%
1 gen 1985 anni
7.55
+1.35
21.76%
1 gen 1986 anni
8.416
+0.866
11.47%
1 gen 1987 anni
6.052
-2.364
-28.09%
1 gen 1988 anni
6.329
+0.277
4.58%
1 gen 1989 anni
8.092
+1.762
27.84%
1 gen 1990 anni
3.235
-4.856
-60.02%
1 gen 1991 anni
4.778
+1.543
47.68%
1 gen 1992 anni
4.686
-0.092
-1.93%
1 gen 1993 anni
2.314
-2.372
-50.62%
1 gen 1994 anni
4.228
+1.914
82.72%
1 gen 1995 anni
5.27
+1.043
24.66%
1 gen 1996 anni
3.82
-1.45
-27.52%
1 gen 1997 anni
6.652
+2.832
74.15%
1 gen 1998 anni
5.658
-0.995
-14.95%
1 gen 1999 anni
5.238
-0.42
-7.42%
1 gen 2000 anni
2.968
-2.27
-43.34%
1 gen 2001 anni
4.377
+1.409
47.48%
1 gen 2002 anni
5.405
+1.028
23.48%
1 gen 2003 anni
3.119
-2.285
-42.28%
1 gen 2004 anni
5.949
+2.83
90.71%
1 gen 2005 anni
3.941
-2.008
-33.76%
1 gen 2006 anni
2.448
-1.493
-37.88%
1 gen 2007 anni
5.169
+2.721
111.17%
1 gen 2008 anni
5.633
+0.464
8.97%
1 gen 2009 anni
5.224
-0.409
-7.27%
1 gen 2010 anni
6.494
+1.27
24.31%
1 gen 2011 anni
10.32
+3.826
58.92%
1 gen 2012 anni
9.004
-1.316
-12.75%
1 gen 2013 anni
7.396
-1.608
-17.86%
1 gen 2014 anni
11.517
+4.122
55.73%
1 gen 2015 anni
12.747
+1.23
10.68%
Classificazione dei paesi secondo i statistiche attuali per anni


Commenti: