29
/it/
it
AIzaSyAYiBZKx7MnpbEhh9jyipgxe19OcubqV5w
April 1, 2024
54183
Pacific island small states
PSS
false
2
1
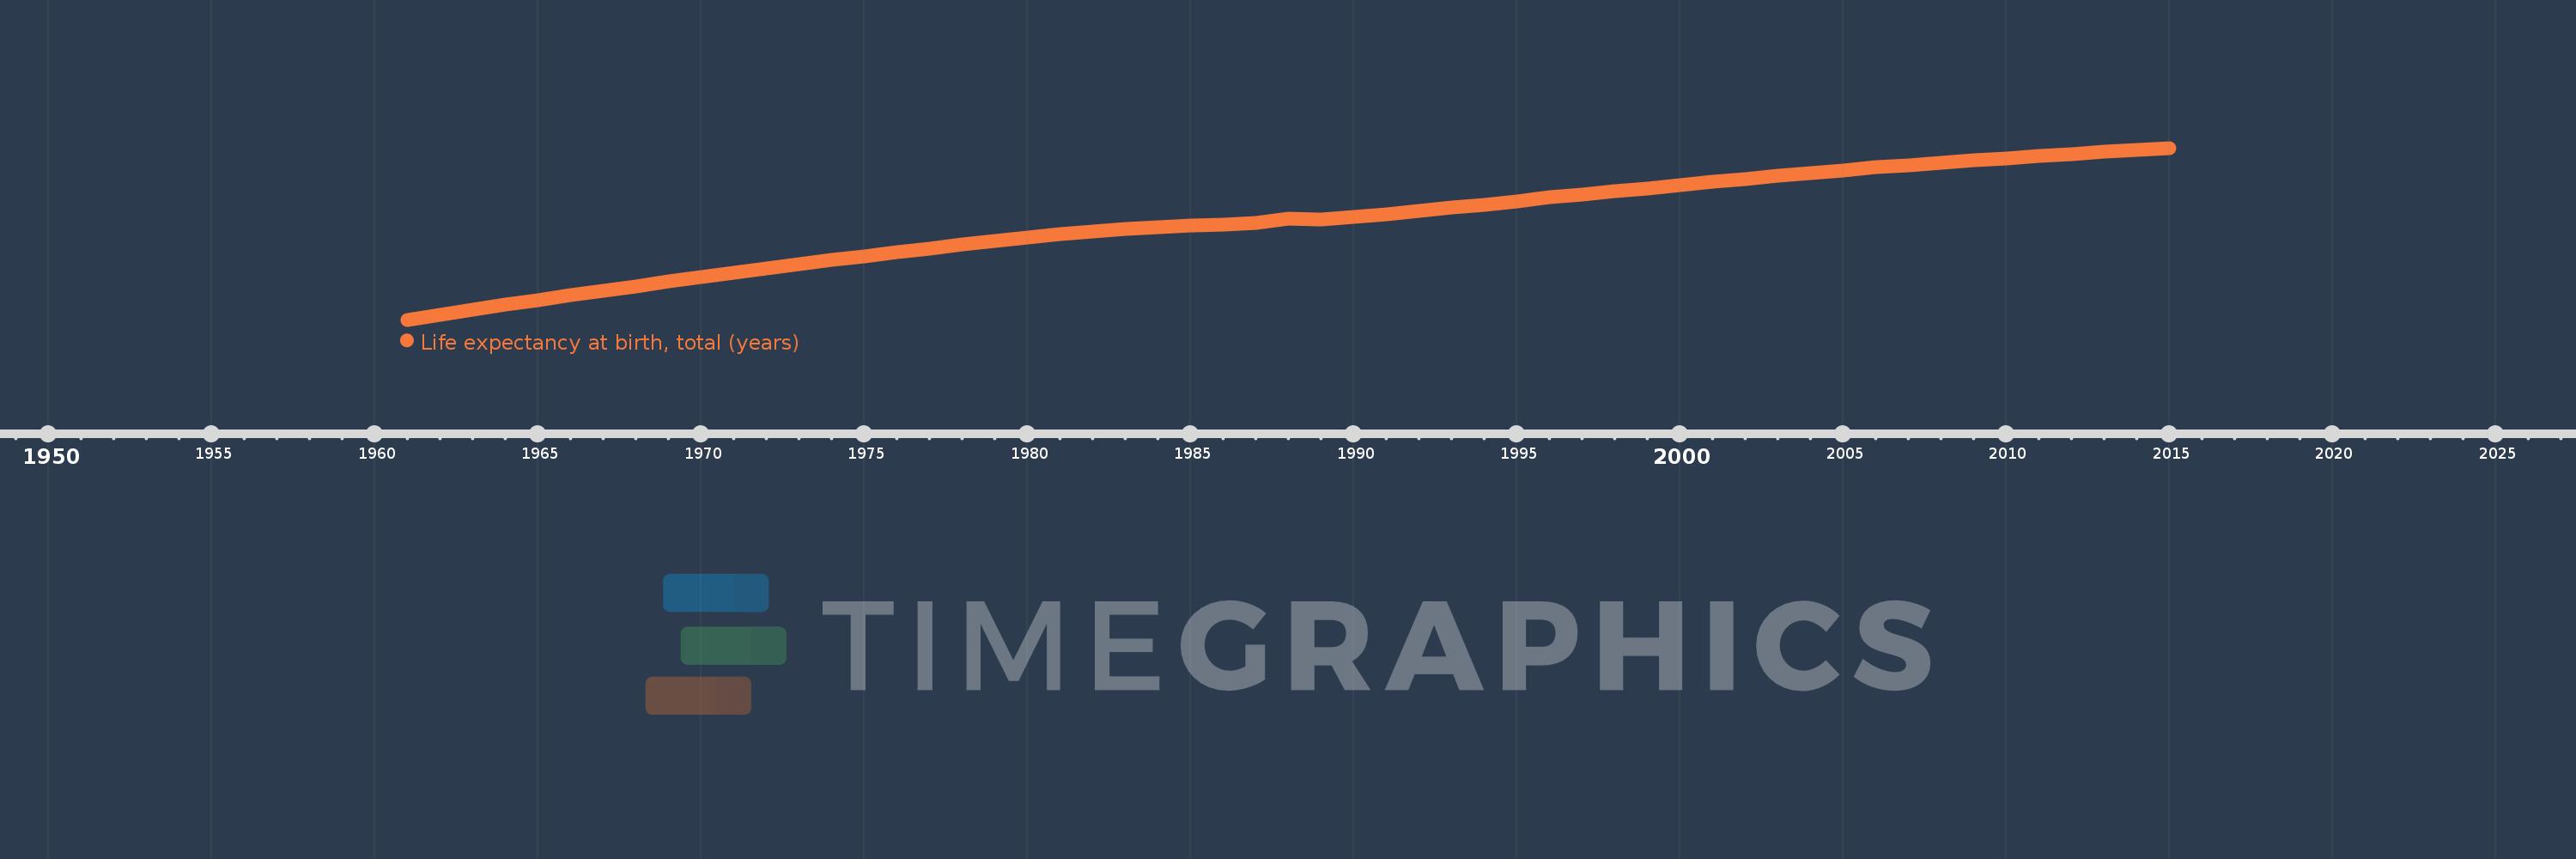
Life expectancy at birth, total (years)
2015,2014,2013,2012,2011,2010,2009,2008,2007,2006,2005,2004,2003,2002,2001,2000,1999,1998,1997,1996,1995,1994,1993,1992,1991,1990,1989,1988,1987,1986,1985,1984,1983,1982,1981,1980,1979,1978,1977,1976,1975,1974,1973,1972,1971,1970,1969,1968,1967,1966,1965,1964,1963,1962,1961
Queste statistiche in altri paesi:
AfghanistanAlbaniaAlgeriaAngolaAntigua and BarbudaArab WorldArgentinaArmeniaArubaAustraliaAustriaAzerbaijanBahamas, TheBahrainBangladeshBarbadosBelarusBelgiumBelizeBeninBermudaBhutanBoliviaBosnia and HerzegovinaBotswanaBrazilBrunei DarussalamBulgariaBurkina FasoBurundiCabo VerdeCambodiaCameroonCanadaCaribbean small statesCentral African RepublicCentral Europe and the BalticsChadChannel IslandsChileChinaColombiaComorosCongo, Dem. Rep.Congo, Rep.Costa RicaCote d'IvoireCroatiaCubaCuracaoCyprusCzech RepublicDenmarkDjiboutiDominicaDominican RepublicEarly-demographic dividendEast Asia & PacificEast Asia & Pacific (excluding high income)East Asia & Pacific (IDA & IBRD countries)EcuadorEgypt, Arab Rep.El SalvadorEquatorial GuineaEritreaEstoniaEthiopiaEuro areaEurope & Central AsiaEurope & Central Asia (excluding high income)Europe & Central Asia (IDA & IBRD countries)European UnionFaroe IslandsFijiFinlandFragile and conflict affected situationsFranceFrench PolynesiaGabonGambia, TheGeorgiaGermanyGhanaGreeceGreenlandGrenadaGuamGuatemalaGuineaGuinea-BissauGuyanaHaitiHeavily indebted poor countries (HIPC)High incomeHondurasHong Kong SAR, ChinaHungaryIBRD onlyIcelandIDA & IBRD totalIDA blendIDA onlyIDA totalIndiaIndonesiaIran, Islamic Rep.IraqIrelandIsle of ManIsraelItalyJamaicaJapanJordanKazakhstanKenyaKiribatiKorea, Dem. People’s Rep.Korea, Rep.KosovoKuwaitKyrgyz RepublicLao PDRLate-demographic dividendLatin America & Caribbean Latin America & Caribbean (excluding high income)Latin America & the Caribbean (IDA & IBRD countries)LatviaLeast developed countries: UN classificationLebanonLesothoLiberiaLibyaLiechtensteinLithuaniaLow & middle incomeLow incomeLower middle incomeLuxembourgMacao SAR, ChinaMacedonia, FYRMadagascarMalawiMalaysiaMaldivesMaliMaltaMarshall IslandsMauritaniaMauritiusMexicoMicronesia, Fed. Sts.Middle East & North AfricaMiddle East & North Africa (excluding high income)Middle East & North Africa (IDA & IBRD countries)Middle incomeMoldovaMongoliaMontenegroMoroccoMozambiqueMyanmarNamibiaNepalNetherlandsNew CaledoniaNew ZealandNicaraguaNigerNigeriaNorth AmericaNorwayOECD membersOmanOther small statesPacific island small statesPakistanPalauPanamaPapua New GuineaParaguayPeruPhilippinesPolandPortugalPost-demographic dividendPre-demographic dividendPuerto RicoQatarRomaniaRussian FederationRwandaSamoaSan MarinoSao Tome and PrincipeSaudi ArabiaSenegalSerbiaSeychellesSierra LeoneSingaporeSint Maarten (Dutch part)Slovak RepublicSloveniaSmall statesSolomon IslandsSomaliaSouth AfricaSouth AsiaSouth Asia (IDA & IBRD)South SudanSpainSri LankaSt. Kitts and NevisSt. LuciaSt. Martin (French part)St. Vincent and the GrenadinesSub-Saharan Africa Sub-Saharan Africa (excluding high income)Sub-Saharan Africa (IDA & IBRD countries)SudanSurinameSwazilandSwedenSwitzerlandSyrian Arab RepublicTajikistanTanzaniaThailandTimor-LesteTogoTongaTrinidad and TobagoTunisiaTurkeyTurkmenistanUgandaUkraineUnited Arab EmiratesUnited KingdomUnited StatesUpper middle incomeUruguayUzbekistanVanuatuVenezuela, RBVietnamVirgin Islands (U.S.)West Bank and GazaWorldYemen, Rep.ZambiaZimbabwe Linea del tempo:
Questa scala temporale mostra un grafico dal 1961 anno al 2015 anno. Pacific island small states. I dati fino ad 1960 anno non disponibili. Il numero di osservazioni attuali secondo i date: 55.
La fonte (nome):
Indicatori dello sviluppo mondiale
La fonte (organizzazione):
Derived from male and female life expectancy at birth from sources such as: (1) United Nations Population Division. World Population Prospects, (2) Census reports and other statistical publications from national statistical offices, (3) Eurostat: Demographic Statistics, (4) United Nations Statistical Division. Population and Vital Statistics Reprot (various years), (5) U.S. Census Bureau: International Database, and (6) Secretariat of the Pacific Community: Statistics and Demography Programme.
Categorie:
Health
sono stati aggiornati
23 apr 2017 anni
Indicatori delle variazioni dei valori per anni
Minima:
53.67
1 gen 1961 anni
Massimo:
69.919
1 gen 2015 anni
Alla data di osservazione
Valore
Variazione assoluta
La variazione rispetto al valore precedente
1 gen 1961 anni
53.67
+53.67
0.0%
1 gen 1962 anni
54.14
+0.47
0.88%
1 gen 1963 anni
54.608
+0.468
0.86%
1 gen 1964 anni
55.07
+0.462
0.85%
1 gen 1965 anni
55.526
+0.456
0.83%
1 gen 1966 anni
55.973
+0.447
0.81%
1 gen 1967 anni
56.414
+0.441
0.79%
1 gen 1968 anni
56.849
+0.435
0.77%
1 gen 1969 anni
57.278
+0.429
0.75%
1 gen 1970 anni
57.7
+0.421
0.74%
1 gen 1971 anni
58.113
+0.414
0.72%
1 gen 1972 anni
58.518
+0.405
0.7%
1 gen 1973 anni
58.914
+0.396
0.68%
1 gen 1974 anni
59.302
+0.387
0.66%
1 gen 1975 anni
59.681
+0.38
0.64%
1 gen 1976 anni
60.054
+0.373
0.62%
1 gen 1977 anni
60.419
+0.365
0.61%
1 gen 1978 anni
60.775
+0.356
0.59%
1 gen 1979 anni
61.119
+0.343
0.57%
1 gen 1980 anni
61.446
+0.327
0.54%
1 gen 1981 anni
61.746
+0.3
0.49%
1 gen 1982 anni
62.009
+0.263
0.43%
1 gen 1983 anni
62.231
+0.222
0.36%
1 gen 1984 anni
62.415
+0.184
0.3%
1 gen 1985 anni
62.565
+0.15
0.24%
1 gen 1986 anni
62.696
+0.131
0.21%
1 gen 1987 anni
62.825
+0.129
0.21%
1 gen 1988 anni
63.212
+0.387
0.62%
1 gen 1989 anni
63.147
-0.065
-0.1%
1 gen 1990 anni
63.366
+0.218
0.35%
1 gen 1991 anni
63.679
+0.313
0.49%
1 gen 1992 anni
63.928
+0.25
0.39%
1 gen 1993 anni
64.249
+0.32
0.5%
1 gen 1994 anni
64.573
+0.324
0.5%
1 gen 1995 anni
64.892
+0.32
0.5%
1 gen 1996 anni
65.268
+0.376
0.58%
1 gen 1997 anni
65.507
+0.238
0.37%
1 gen 1998 anni
65.807
+0.301
0.46%
1 gen 1999 anni
66.109
+0.302
0.46%
1 gen 2000 anni
66.44
+0.331
0.5%
1 gen 2001 anni
66.705
+0.266
0.4%
1 gen 2002 anni
66.999
+0.294
0.44%
1 gen 2003 anni
67.282
+0.283
0.42%
1 gen 2004 anni
67.553
+0.271
0.4%
1 gen 2005 anni
67.812
+0.259
0.38%
1 gen 2006 anni
68.068
+0.257
0.38%
1 gen 2007 anni
68.291
+0.222
0.33%
1 gen 2008 anni
68.513
+0.223
0.33%
1 gen 2009 anni
68.728
+0.215
0.31%
1 gen 2010 anni
68.936
+0.209
0.3%
1 gen 2011 anni
69.14
+0.204
0.3%
1 gen 2012 anni
69.34
+0.2
0.29%
1 gen 2013 anni
69.535
+0.196
0.28%
1 gen 2014 anni
69.728
+0.193
0.28%
1 gen 2015 anni
69.919
+0.191
0.27%
Classificazione dei paesi secondo i statistiche attuali per anni


Commenti: