29
/it/
it
AIzaSyAYiBZKx7MnpbEhh9jyipgxe19OcubqV5w
April 1, 2024
201809
Morocco
MAR
true
2
1
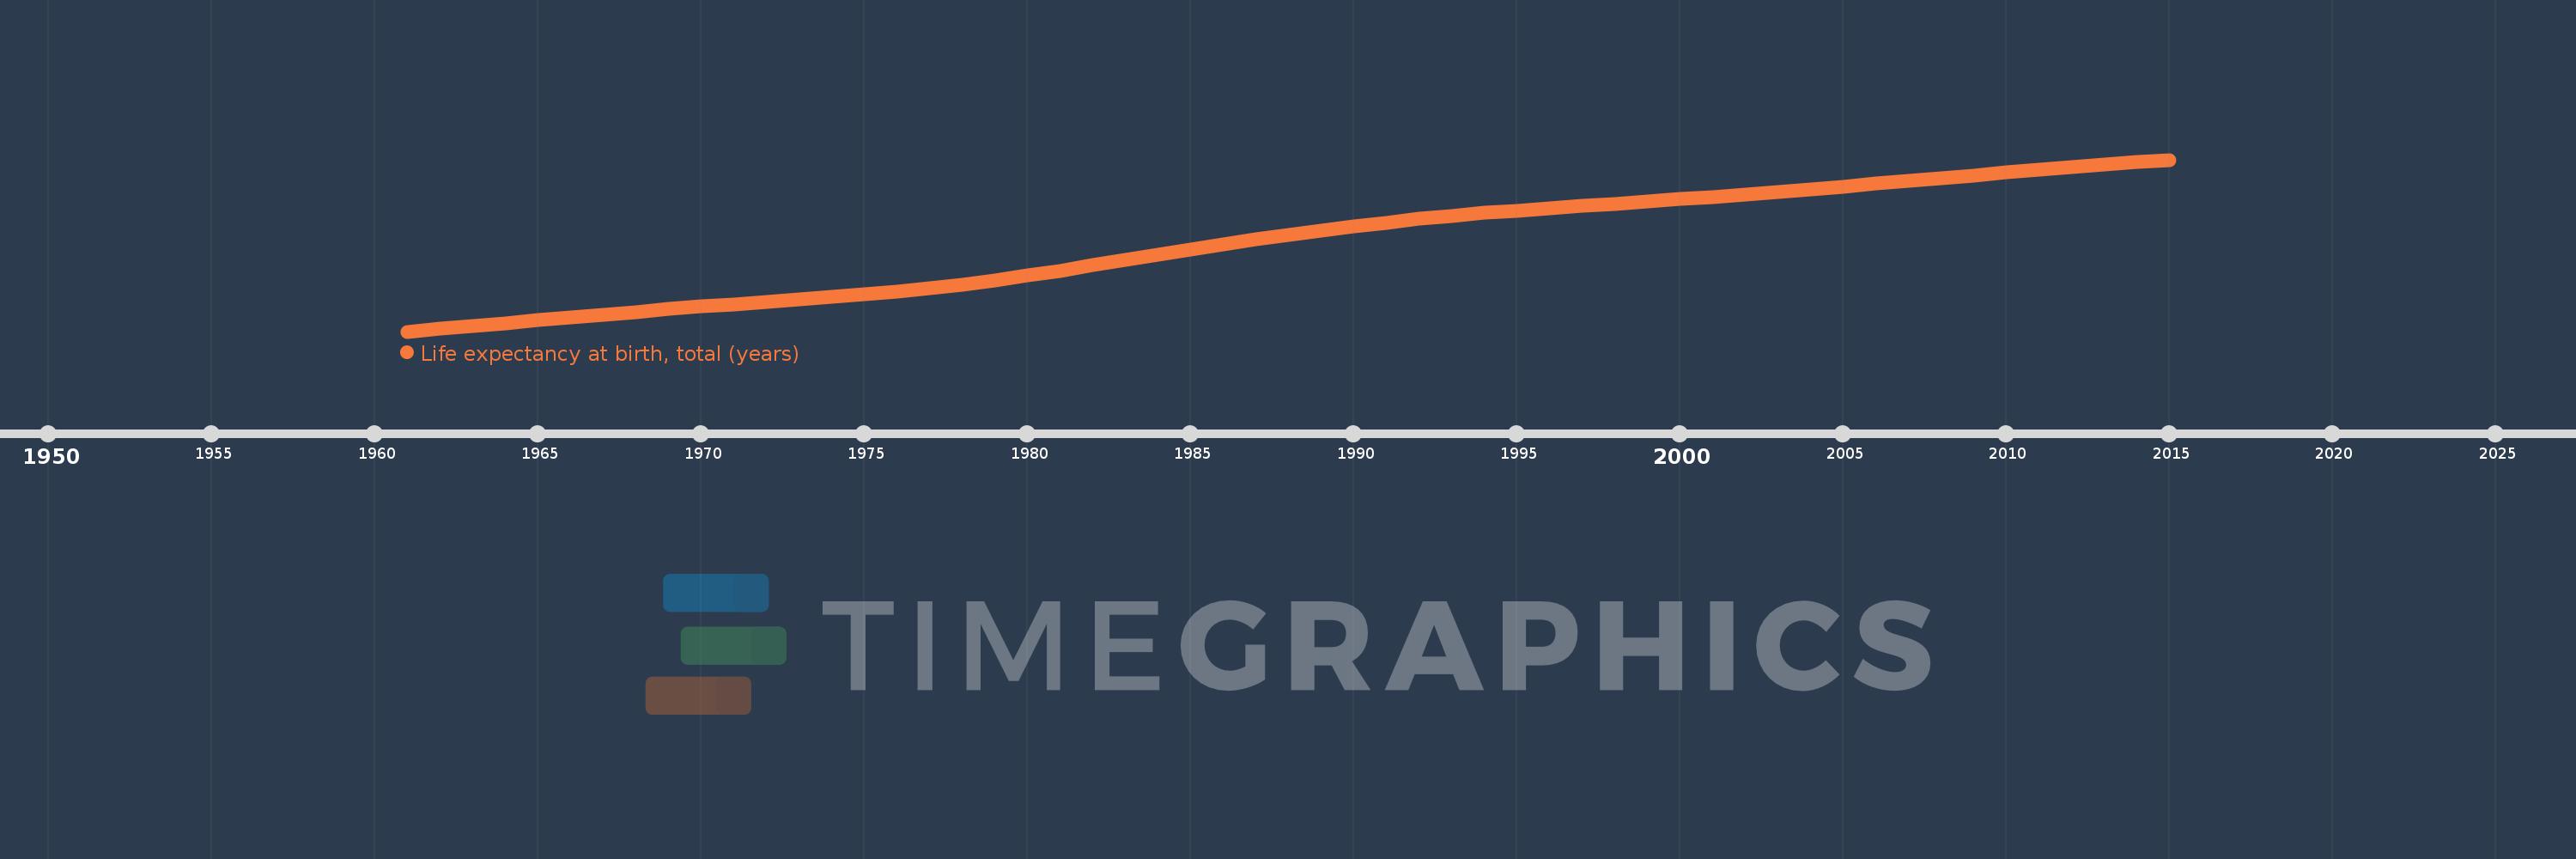
Life expectancy at birth, total (years)
2015,2014,2013,2012,2011,2010,2009,2008,2007,2006,2005,2004,2003,2002,2001,2000,1999,1998,1997,1996,1995,1994,1993,1992,1991,1990,1989,1988,1987,1986,1985,1984,1983,1982,1981,1980,1979,1978,1977,1976,1975,1974,1973,1972,1971,1970,1969,1968,1967,1966,1965,1964,1963,1962,1961
Queste statistiche in altri paesi:
AfghanistanAlbaniaAlgeriaAngolaAntigua and BarbudaArab WorldArgentinaArmeniaArubaAustraliaAustriaAzerbaijanBahamas, TheBahrainBangladeshBarbadosBelarusBelgiumBelizeBeninBermudaBhutanBoliviaBosnia and HerzegovinaBotswanaBrazilBrunei DarussalamBulgariaBurkina FasoBurundiCabo VerdeCambodiaCameroonCanadaCaribbean small statesCentral African RepublicCentral Europe and the BalticsChadChannel IslandsChileChinaColombiaComorosCongo, Dem. Rep.Congo, Rep.Costa RicaCote d'IvoireCroatiaCubaCuracaoCyprusCzech RepublicDenmarkDjiboutiDominicaDominican RepublicEarly-demographic dividendEast Asia & PacificEast Asia & Pacific (excluding high income)East Asia & Pacific (IDA & IBRD countries)EcuadorEgypt, Arab Rep.El SalvadorEquatorial GuineaEritreaEstoniaEthiopiaEuro areaEurope & Central AsiaEurope & Central Asia (excluding high income)Europe & Central Asia (IDA & IBRD countries)European UnionFaroe IslandsFijiFinlandFragile and conflict affected situationsFranceFrench PolynesiaGabonGambia, TheGeorgiaGermanyGhanaGreeceGreenlandGrenadaGuamGuatemalaGuineaGuinea-BissauGuyanaHaitiHeavily indebted poor countries (HIPC)High incomeHondurasHong Kong SAR, ChinaHungaryIBRD onlyIcelandIDA & IBRD totalIDA blendIDA onlyIDA totalIndiaIndonesiaIran, Islamic Rep.IraqIrelandIsle of ManIsraelItalyJamaicaJapanJordanKazakhstanKenyaKiribatiKorea, Dem. People’s Rep.Korea, Rep.KosovoKuwaitKyrgyz RepublicLao PDRLate-demographic dividendLatin America & Caribbean Latin America & Caribbean (excluding high income)Latin America & the Caribbean (IDA & IBRD countries)LatviaLeast developed countries: UN classificationLebanonLesothoLiberiaLibyaLiechtensteinLithuaniaLow & middle incomeLow incomeLower middle incomeLuxembourgMacao SAR, ChinaMacedonia, FYRMadagascarMalawiMalaysiaMaldivesMaliMaltaMarshall IslandsMauritaniaMauritiusMexicoMicronesia, Fed. Sts.Middle East & North AfricaMiddle East & North Africa (excluding high income)Middle East & North Africa (IDA & IBRD countries)Middle incomeMoldovaMongoliaMontenegroMoroccoMozambiqueMyanmarNamibiaNepalNetherlandsNew CaledoniaNew ZealandNicaraguaNigerNigeriaNorth AmericaNorwayOECD membersOmanOther small statesPacific island small statesPakistanPalauPanamaPapua New GuineaParaguayPeruPhilippinesPolandPortugalPost-demographic dividendPre-demographic dividendPuerto RicoQatarRomaniaRussian FederationRwandaSamoaSan MarinoSao Tome and PrincipeSaudi ArabiaSenegalSerbiaSeychellesSierra LeoneSingaporeSint Maarten (Dutch part)Slovak RepublicSloveniaSmall statesSolomon IslandsSomaliaSouth AfricaSouth AsiaSouth Asia (IDA & IBRD)South SudanSpainSri LankaSt. Kitts and NevisSt. LuciaSt. Martin (French part)St. Vincent and the GrenadinesSub-Saharan Africa Sub-Saharan Africa (excluding high income)Sub-Saharan Africa (IDA & IBRD countries)SudanSurinameSwazilandSwedenSwitzerlandSyrian Arab RepublicTajikistanTanzaniaThailandTimor-LesteTogoTongaTrinidad and TobagoTunisiaTurkeyTurkmenistanUgandaUkraineUnited Arab EmiratesUnited KingdomUnited StatesUpper middle incomeUruguayUzbekistanVanuatuVenezuela, RBVietnamVirgin Islands (U.S.)West Bank and GazaWorldYemen, Rep.ZambiaZimbabwe Linea del tempo:
Questa scala temporale mostra un grafico dal 1961 anno al 2015 anno. Morocco. I dati fino ad 1960 anno non disponibili. Il numero di osservazioni attuali secondo i date: 55.
La fonte (nome):
Indicatori dello sviluppo mondiale
La fonte (organizzazione):
Derived from male and female life expectancy at birth from sources such as: (1) United Nations Population Division. World Population Prospects, (2) Census reports and other statistical publications from national statistical offices, (3) Eurostat: Demographic Statistics, (4) United Nations Statistical Division. Population and Vital Statistics Reprot (various years), (5) U.S. Census Bureau: International Database, and (6) Secretariat of the Pacific Community: Statistics and Demography Programme.
Categorie:
Health
sono stati aggiornati
23 apr 2017 anni
Indicatori delle variazioni dei valori per anni
Minima:
48.447
1 gen 1961 anni
Massimo:
74.016
1 gen 2015 anni
Alla data di osservazione
Valore
Variazione assoluta
La variazione rispetto al valore precedente
1 gen 1961 anni
48.447
+48.447
0.0%
1 gen 1962 anni
48.864
+0.417
0.86%
1 gen 1963 anni
49.288
+0.423
0.87%
1 gen 1964 anni
49.715
+0.427
0.87%
1 gen 1965 anni
50.142
+0.427
0.86%
1 gen 1966 anni
50.565
+0.423
0.84%
1 gen 1967 anni
50.978
+0.413
0.82%
1 gen 1968 anni
51.381
+0.403
0.79%
1 gen 1969 anni
51.775
+0.394
0.77%
1 gen 1970 anni
52.16
+0.385
0.74%
1 gen 1971 anni
52.537
+0.377
0.72%
1 gen 1972 anni
52.904
+0.366
0.7%
1 gen 1973 anni
53.267
+0.363
0.69%
1 gen 1974 anni
53.636
+0.37
0.69%
1 gen 1975 anni
54.024
+0.388
0.72%
1 gen 1976 anni
54.449
+0.424
0.79%
1 gen 1977 anni
54.931
+0.482
0.89%
1 gen 1978 anni
55.478
+0.547
1.0%
1 gen 1979 anni
56.094
+0.616
1.11%
1 gen 1980 anni
56.775
+0.681
1.21%
1 gen 1981 anni
57.513
+0.737
1.3%
1 gen 1982 anni
58.292
+0.779
1.35%
1 gen 1983 anni
59.092
+0.8
1.37%
1 gen 1984 anni
59.89
+0.798
1.35%
1 gen 1985 anni
60.669
+0.78
1.3%
1 gen 1986 anni
61.421
+0.751
1.24%
1 gen 1987 anni
62.139
+0.718
1.17%
1 gen 1988 anni
62.827
+0.688
1.11%
1 gen 1989 anni
63.483
+0.657
1.05%
1 gen 1990 anni
64.105
+0.621
0.98%
1 gen 1991 anni
64.68
+0.576
0.9%
1 gen 1992 anni
65.203
+0.523
0.81%
1 gen 1993 anni
65.672
+0.469
0.72%
1 gen 1994 anni
66.094
+0.421
0.64%
1 gen 1995 anni
66.473
+0.379
0.57%
1 gen 1996 anni
66.821
+0.348
0.52%
1 gen 1997 anni
67.149
+0.328
0.49%
1 gen 1998 anni
67.471
+0.322
0.48%
1 gen 1999 anni
67.799
+0.328
0.49%
1 gen 2000 anni
68.139
+0.34
0.5%
1 gen 2001 anni
68.498
+0.358
0.53%
1 gen 2002 anni
68.872
+0.374
0.55%
1 gen 2003 anni
69.256
+0.384
0.56%
1 gen 2004 anni
69.645
+0.389
0.56%
1 gen 2005 anni
70.039
+0.393
0.56%
1 gen 2006 anni
70.44
+0.401
0.57%
1 gen 2007 anni
70.852
+0.413
0.59%
1 gen 2008 anni
71.278
+0.425
0.6%
1 gen 2009 anni
71.711
+0.434
0.61%
1 gen 2010 anni
72.148
+0.437
0.61%
1 gen 2011 anni
72.577
+0.429
0.59%
1 gen 2012 anni
72.985
+0.409
0.56%
1 gen 2013 anni
73.365
+0.379
0.52%
1 gen 2014 anni
73.709
+0.344
0.47%
1 gen 2015 anni
74.016
+0.307
0.42%
Classificazione dei paesi secondo i statistiche attuali per anni


Commenti: